Memorex 2012 Annual Report Download - page 27
Download and view the complete annual report
Please find page 27 of the 2012 Memorex annual report below. You can navigate through the pages in the report by either clicking on the pages listed below, or by using the keyword search tool below to find specific information within the annual report.-
 1
1 -
2
-
3
-
4
-
5
-
6
-
7
-
8
-
9
-
10
-
11
-
12
-
13
-
14
-
15
-
16
-
 17
17 -
 18
18 -
 19
19 -
 20
20 -
 21
21 -
 22
22 -
 23
23 -
 24
24 -
 25
25 -
 26
26 -
 27
27 -
 28
28 -
 29
29 -
 30
30 -
 31
31 -
 32
32 -
 33
33 -
 34
34 -
 35
35 -
 36
36 -
 37
37 -
38
-
39
-
40
-
41
-
42
-
43
-
44
-
45
-
46
-
47
-
48
-
49
-
50
-
51
-
52
-
53
-
54
-
55
-
56
-
57
-
58
-
59
-
60
-
61
-
62
-
63
-
64
-
65
-
66
-
67
-
68
-
69
-
70
-
71
-
72
-
73
-
74
-
75
-
76
-
77
-
78
-
79
-
80
-
81
-
82
-
83
-
84
-
85
-
86
-
87
-
88
-
89
-
90
-
91
-
92
-
93
-
94
-
95
-
96
-
97
-
98
-
99
-
100
-
101
-
102
-
103
-
104
-
105
-
106
-
107
-
108
-
109
-
110
-
111
-
112
-
113
-
114
-
115
-
116
 |
 |

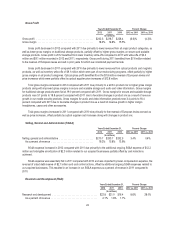
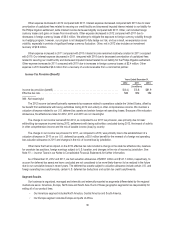
Gross Profit
Years Ended December 31, Percent Change
2012 2011 2010 2012 vs. 2011 2011 vs. 2010
(In millions)
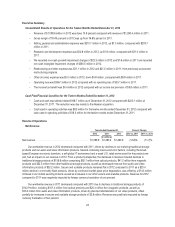
Gross profit .......................................... $202.3 $216.7 $226.4 (6.6)% (4.3)%
Gross margin ......................................... 18.4% 16.8% 15.5%
Gross profit decreased in 2012 compared with 2011 due primarily to lower revenue from all major product categories, as
well as lower gross margins on traditional storage products, partially offset by higher gross margins on secure and scalable
storage products. Gross profit in 2012 benefited from lower inventory write-offs compared to 2011 with write-offs of $2.3
million and $9.1 million recorded in 2012 and 2011, respectively. Gross profit during 2011 benefited from $7.8 million related
to the reversal of European levies accrued in prior years for which we considered payment remote.
Gross profit decreased in 2011 compared with 2010 due primarily to lower revenues from optical products and magnetic
products, as well as inventory write-offs of $9.1 million which were part of our restructuring programs, offset partially by higher
gross margins on all product categories. Optical gross profit benefited from the $7.8 million reversal of European levies and
price increases which were partially offset by optical supplier price increases of $12.8 million.
Total gross margins increased in 2012 compared with 2011 due primarily to a shift in product mix to higher gross margin
products along with improved gross margins in secure and scalable storage and audio and video information. Gross margins
for traditional storage products were flat at 19.0 percent compared with 2011. Gross margins for secure and scalable storage
products rose 3.7 points to 18.8 percent compared with 2011 due to favorable changes in product mix as a result of revenue
growth in our mobile security products. Gross margins for audio and video information products rose 3.4 points to 16.4
percent compared with 2011 due to favorable changes in product mix as a result of revenue growth in higher margin
headphones, cases and other accessories.
Total gross margins increased in 2011 compared with 2010 due primarily to the reversal of European levies accrued as
well as price increases, offset partially by optical supplier cost increases along with changes in product mix.
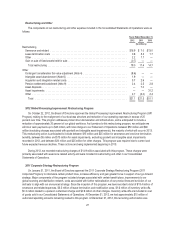
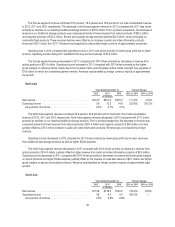
Selling, General and Administrative (SG&A)
Years Ended December 31, Percent Change
2012 2011 2010 2012 vs. 2011 2011 vs. 2010
(In millions)
Selling, general and administrative ......................... $210.7 $203.7 $202.5 3.4% 0.6%
As a percent of revenue ............................... 19.2% 15.8% 13.9%
SG&A expense increased in 2012 compared with 2011 due primarily to the additional ongoing SG&A expense of $12.2
million and intangible amortization of $2.3 million related to our acquired businesses partially offset by cost reductions
achieved.
SG&A expense was essentially flat in 2011 compared with 2010 and was impacted by lower compensation expense, the
reversal of a bad debt reserve of $2.7 million and cost control actions, offset by additional ongoing SG&A expenses related to
our acquired businesses. This resulted in an increase in our SG&A expense as a percent of revenue in 2011 compared to
2010.
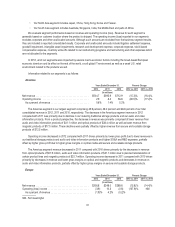
Research and Development (R&D)
Years Ended December 31, Percent Change
2012 2011 2010 2012 vs. 2011 2011 vs. 2010
(In millions)
Research and development ................................. $22.8 $21.0 $16.4 8.6% 28.0%
As a percent of revenue .................................. 2.1% 1.6% 1.1%
24