Memorex 2012 Annual Report Download - page 33
Download and view the complete annual report
Please find page 33 of the 2012 Memorex annual report below. You can navigate through the pages in the report by either clicking on the pages listed below, or by using the keyword search tool below to find specific information within the annual report.-
 1
1 -
2
-
3
-
4
-
5
-
6
-
7
-
8
-
9
-
10
-
11
-
12
-
13
-
14
-
15
-
16
-
17
-
18
-
19
-
20
-
21
-
22
-
 23
23 -
 24
24 -
 25
25 -
 26
26 -
 27
27 -
 28
28 -
 29
29 -
 30
30 -
 31
31 -
 32
32 -
 33
33 -
 34
34 -
 35
35 -
 36
36 -
 37
37 -
 38
38 -
 39
39 -
 40
40 -
 41
41 -
 42
42 -
 43
43 -
44
-
45
-
46
-
47
-
48
-
49
-
50
-
51
-
52
-
53
-
54
-
55
-
56
-
57
-
58
-
59
-
60
-
61
-
62
-
63
-
64
-
65
-
66
-
67
-
68
-
69
-
70
-
71
-
72
-
73
-
74
-
75
-
76
-
77
-
78
-
79
-
80
-
81
-
82
-
83
-
84
-
85
-
86
-
87
-
88
-
89
-
90
-
91
-
92
-
93
-
94
-
95
-
96
-
97
-
98
-
99
-
100
-
101
-
102
-
103
-
104
-
105
-
106
-
107
-
108
-
109
-
110
-
111
-
112
-
113
-
114
-
115
-
116
 |
 |

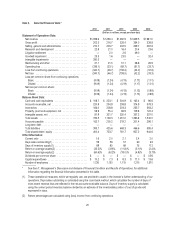
Other expense decreased in 2012 compared with 2011. Interest expense decreased compared with 2011 due to lower
amortization of capitalized fees related to securing our credit facility and decreased imputed interest related to our liability for
the Philips litigation settlement, while interest income decreased slightly compared with 2011. Other, net includes foreign
currency losses and gains or losses from investments. Other expense decreased in 2012 compared with 2011 due to
decreases in foreign currency losses of $3.0 million. We attempt to mitigate the exposure to foreign currency volatility through
our hedging program; however, our program is not designed to fully hedge our risk, and as a result, we experience some
volatility, especially in periods of significant foreign currency fluctuation. Other, net in 2012 also includes an investment
recovery of $0.9 million.
Other expense increased in 2011 compared with 2010. Interest income remained relatively constant in 2011 compared
with 2010. Our interest expense decreased in 2011 compared with 2010 due to decreased amortization of capitalized fees
related to securing our credit facility and decreased imputed interest related to our liability for the Philips litigation settlement.
Other expense increased in 2011 compared with 2010 due to increases in foreign currency losses of $2.4 million. Other
expense in 2010 benefited $2.0 million from a recovery of a note receivable from a commercial partner.
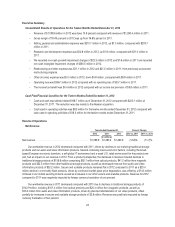
Income Tax Provision (Benefit)
Years Ended December 31,
2012 2011 2010
(In millions)
Income tax provision (benefit) ............................................... $(0.4) $ 3.8 $81.9
Effective tax rate ......................................................... NM NM NM
NM - Not meaningful
The 2012 income tax benefit primarily represents tax expense related to operations outside the United States, offset by
tax benefit from settlements with taxing authorities during 2012 and activity in other comprehensive income. We maintain a
valuation allowance related to our U.S. deferred tax assets and certain foreign net operating losses. Because of the valuation
allowances, the effective tax rates for 2012, 2011 and 2010 are not meaningful.
The change in our income tax benefit for 2012, as compared to our 2011 tax provision, was primarily due to lower
withholding tax expense incurred during 2012, settlements with taxing authorities concluded during 2012, the impact of activity
in other comprehensive income and the mix of taxable income (loss) by country.
The change in our income tax provision for 2011, as compared to 2010, was primarily due to the establishment of a
valuation allowance in 2010 on our U.S. deferred tax assets, a $5.0 million benefit for the reversal of a foreign net operating
loss valuation allowance in 2011 and changes in the mix of income/loss by jurisdiction.
Other items that had an impact on the 2010 effective tax rate included a change in the state tax effective rate, reserves
for uncertain tax positions, foreign earnings subject to U.S. taxation, and changes in the mix of income by jurisdiction. See
Note 10 — Income Taxes in our Notes to Consolidated Financial Statements for further information.
As of December 31, 2012 and 2011, we had valuation allowances of $239.1 million and $141.1 million, respectively, to
account for deferred tax assets we have concluded are not considered to be more-likely-than-not to be realized in the future
due to our cumulative losses in recent years. The deferred tax assets subject to valuation allowance include certain U.S. and
foreign operating loss carryforwards, certain U.S. deferred tax deductions and certain tax credit carryforwards.
Segment Results
Our business is organized, managed and internally and externally reported as segments differentiated by the regional
markets we serve: Americas, Europe, North Asia and South Asia. Each of these geographic segments has responsibility for
selling all of our product lines.
• Our Americas segment includes North America, Central America and South America.
• Our Europe segment includes Europe and parts of Africa.
30