Memorex 2012 Annual Report Download - page 35
Download and view the complete annual report
Please find page 35 of the 2012 Memorex annual report below. You can navigate through the pages in the report by either clicking on the pages listed below, or by using the keyword search tool below to find specific information within the annual report.-
 1
1 -
2
-
3
-
4
-
5
-
6
-
7
-
8
-
9
-
10
-
11
-
12
-
13
-
14
-
15
-
16
-
17
-
18
-
19
-
20
-
21
-
22
-
23
-
24
-
 25
25 -
 26
26 -
 27
27 -
 28
28 -
 29
29 -
 30
30 -
 31
31 -
 32
32 -
 33
33 -
 34
34 -
 35
35 -
 36
36 -
 37
37 -
 38
38 -
 39
39 -
 40
40 -
 41
41 -
 42
42 -
 43
43 -
 44
44 -
 45
45 -
46
-
47
-
48
-
49
-
50
-
51
-
52
-
53
-
54
-
55
-
56
-
57
-
58
-
59
-
60
-
61
-
62
-
63
-
64
-
65
-
66
-
67
-
68
-
69
-
70
-
71
-
72
-
73
-
74
-
75
-
76
-
77
-
78
-
79
-
80
-
81
-
82
-
83
-
84
-
85
-
86
-
87
-
88
-
89
-
90
-
91
-
92
-
93
-
94
-
95
-
96
-
97
-
98
-
99
-
100
-
101
-
102
-
103
-
104
-
105
-
106
-
107
-
108
-
109
-
110
-
111
-
112
-
113
-
114
-
115
-
116
 |
 |

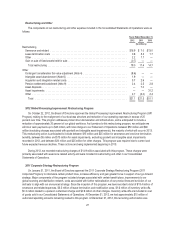
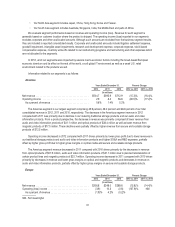
The Europe segment revenue comprised 19.0 percent, 19.2 percent and 19.8 percent of our total consolidated revenue
in 2012, 2011 and 2010, respectively. The decrease in the Europe segment revenue in 2012 compared with 2011 was driven
primarily by declines in our maturing traditional storage products of $37.8 million. From a product perspective, the decrease in
revenue in our traditional storage products was composed primarily of lower revenue from optical products of $20.2 million
and magnetic products of $12.2 million. Secure and scalable storage products declined $4.3 million, driven principally by
commodity flash products. These revenue declines were offset by an increase in audio and video information products
revenues of $3.1 million from 2011. Revenue was impacted by unfavorable foreign currency of approximately six percent.
Operating loss in 2012 compared with operating income in 2011 was driven primarily by lower gross profit due to lower
revenue. Operating income during 2011 benefited from levy accrual reversals of $7.8 million
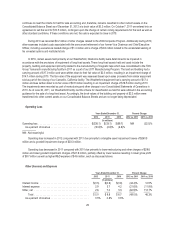
The Europe segment revenue decreased in 2011 compared with 2010 driven primarily by decreases in revenue from
optical products of $31.4 million. Operating income increased in 2011 compared with 2010 driven primarily by the higher
gross margins on optical products mainly due to the reversal of prior year European optical media copyright levy payables of
$7.8 million for which we considered payment remote. Revenue was benefited by foreign currency impacts of approximately
six percent.
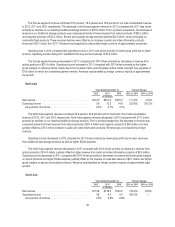
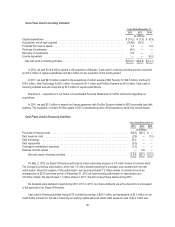
North Asia
Years Ended December 31, Percent Change
2012 2011 2010 2012 vs. 2011 2011 vs. 2010
(In millions)
Net revenue ....................................... $272.5 $307.2 $315.2 (11.3)% (2.5)%
Operating income .................................. 5.9 12.5 14.9 (52.8)% (16.1)%
As a percent of revenue ............................ 2.2% 4.1% 4.7%
The North Asia segment revenue comprised 24.8 percent, 23.8 percent and 21.6 percent of our total consolidated
revenue in 2012, 2011 and 2010, respectively. North Asia segment revenue decreased in 2012 compared with 2011 driven
primarily by declines in our maturing traditional storage products. From a product perspective, the decrease in revenue was
composed primarily of lower revenue from optical products of $21.4 million and magnetic products of $8.5 million and was
partially offset by a $7.3 million increase in audio and video information products. Revenue was not impacted by foreign
currency.
Operating income decreased in 2012 compared to 2011 driven primarily by lower gross profit due to lower revenues
from traditional data storage products as well as higher SG&A expense.
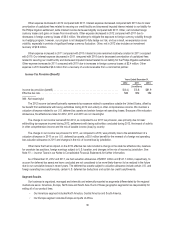
The North Asia segment revenue decreased in 2011 compared with 2010 driven primarily by declines in revenue from
optical products of $14.4 million, partially offset by higher revenue from audio and video information products of $5.3 million.
Operating income decreased in 2011 compared with 2010 driven primarily by decreases in revenue and lower gross margins
on optical products and higher SG&A expense, partially offset by the reversal of a bad debt reserve of $2.7 million and higher
gross margins on secure and scalable products. Revenue was benefited by foreign currency impacts of approximately eight
percent.
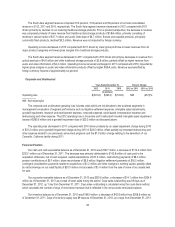
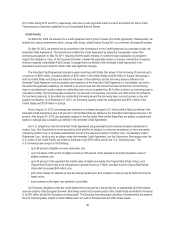
South Asia
Years Ended December 31, Percent Change
2012 2011 2010 2012 vs. 2011 2011 vs. 2010
(In millions)
Net revenue ....................................... $113.6 $139.3 $143.0 (18.4)% (2.6)%
Operating income .................................. 0.6 4.0 4.0 (85.0)% —
As a percent of revenue ............................ 0.5% 2.9% 2.8%
32