JVC 2007 Annual Report Download - page 57
Download and view the complete annual report
Please find page 57 of the 2007 JVC annual report below. You can navigate through the pages in the report by either clicking on the pages listed below, or by using the keyword search tool below to find specific information within the annual report.
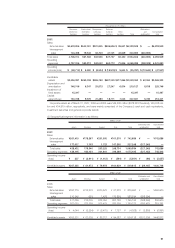
Had the new business segmentation been adopted, the business segment information for the year ended March
31, 2007 would have been as follows:
Millions of yen
Consumer Professional Components Eliminations
electronics electronics & Devices Entertainment Other and Consolidated
business business business business business Total unallocation total
2007:
Sales
External sales ¥543,255 ¥63,962 ¥35,613 ¥82,331 ¥17,525 ¥742,686 ¥ — ¥742,686
Intersegment
sales 12,326 2,306 3,859 4,210 5,659 28,360 (28,360) —
Total sales 555,581 66,268 39,472 86,541 23,184 771,046 (28,360) 742,686
Operating
expenses 558,969 65,291 40,479 86,513 23,963 775,215 (26,872) 748,343
Operating
income (loss) ¥(3,388) ¥ 977 ¥ (1,007) ¥ 28 ¥ (779) ¥ (4,169) ¥ (1,488) ¥ (5,657)
Identifiable assets ¥240,293 ¥31,271 ¥33,841 ¥68,649 ¥39,287 ¥413,341 ¥ 7,367 ¥420,708
Depreciation and
amortization 17,316 985 3,525 2,382 1,649 25,857 781 26,638
Impairment of
fixed assets 1,805 — — — — 1,805 — 1,805
Capital
expenditures 15,433 1,130 4,895 1,276 1,770 24,504 682 25,186
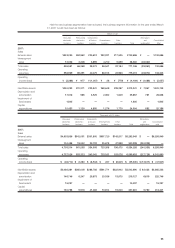
Thousands of U.S. dollars
Consumer Professional Components Eliminations
electronics electronics & Devices Entertainment Other and Consolidated
business business business business business Total unallocation total
2007:
Sales
External sales $4,603,856 $542,051 $301,805 $697,720 $148,517 $6,293,949 $ — $6,293,949
Intersegment
sales 104,458 19,542 32,703 35,678 47,958 240,339 (240,339) —
Total sales 4,708,314 561,593 334,508 733,398 196,475 6,534,288 (240,339) 6,293,949
Operating
expenses 4,737,026 553,313 343,042 733,161 203,076 6,569,618 (227,728) 6,341,890
Operating
income (loss) $(28,712) $ 8,280 $ (8,534) $ 237 $ (6,601) $ (35,330) $ (12,611) $ (47,941)
Identifiable assets $2,036,381 $265,008 $286,788 $581,771 $332,942 $3,502,890 $ 62,433 $3,565,323
Depreciation and
amortization 146,746 8,347 29,873 20,186 13,975 219,127 6,619 225,746
Impairment of
fixed assets 15,297 — — — — 15,297 — 15,297
Capital
expenditures 130,788 9,576 41,483 10,814 15,000 207,661 5,780 213,441
55


