JVC 2007 Annual Report Download - page 54
Download and view the complete annual report
Please find page 54 of the 2007 JVC annual report below. You can navigate through the pages in the report by either clicking on the pages listed below, or by using the keyword search tool below to find specific information within the annual report.-
 1
1 -
2
-
3
-
4
-
5
-
6
-
7
-
8
-
9
-
10
-
11
-
12
-
13
-
14
-
15
-
16
-
17
-
18
-
19
-
20
-
21
-
22
-
23
-
24
-
25
-
26
-
27
-
28
-
29
-
30
-
31
-
32
-
33
-
34
-
35
-
36
-
37
-
38
-
39
-
40
-
41
-
42
-
43
-
 44
44 -
 45
45 -
 46
46 -
 47
47 -
 48
48 -
 49
49 -
 50
50 -
 51
51 -
 52
52 -
 53
53 -
 54
54 -
 55
55 -
 56
56 -
 57
57 -
 58
58 -
 59
59 -
 60
60
 |
 |

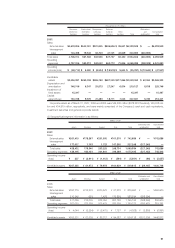
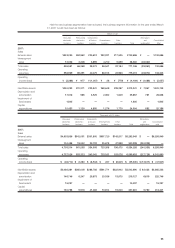
Millions of yen
Elimination and Consolidated
Japan Americas Europe Asia Total unallocation total
2005:
Sales
External sales ¥312,827 ¥201,113 ¥228,875 ¥097,776 ¥0,840,591 ¥ — ¥840,591
Intersegment
sales 206,559 82 1,518 203,456 411,615 (411,615) —
Total sales 519,386 201,195 230,393 301,232 1,252,206 (411,615) 840,591
Operating expenses 517,046 201,241 227,371 296,551 1,242,209 (411,988) 830,221
Operating income
(loss) ¥002,340 ¥ (46) ¥003,022 ¥004,681 ¥0,009,997 ¥000,373 ¥010,370
Identifiable assets ¥308,060 ¥074,275 ¥087,859 ¥091,740 ¥0,561,934 ¥ (95,385) ¥466,549
Thousands of U.S. dollars
Elimination and Consolidated
Japan Americas Europe Asia Total unallocation total
2007:
Sales
External sales $2,215,382 $1,511,754 $1,707,669 $0,859,144 $6,293,949 $ — $6,293,949
Intersegment
sales 1,500,144 9,771 14,602 1,248,771 2,773,288 (2,773,288) —
Total sales 3,715,526 1,521,525 1,722,271 2,107,915 9,067,237 (2,773,288) 6,293,949
Operating
expenses 3,712,754 1,554,669 1,734,246 2,112,695 9,114,364 (2,772,474) 6,341,890
Operating income
(loss) $0,002,772 $ (33,144) $ (11,975) $ (4,780) $ (47,127) $000,0(814) $ (47,941)
Identifiable assets $2,264,703 $0,525,195 $0,677,780 $0,852,788 $4,320,466 $ (755,143) $3,565,323
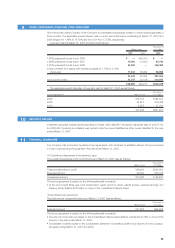
(3) Overseas sales information by geographic area is as follows:
Millions of yen
Americas Europe Asia Other areas Total
2007:
Overseas sales ¥183,512 ¥205,411 ¥117,241 ¥6,943 ¥513,107
Consolidated sales ¥742,686
Ratio of overseas sales to consolidated sales 24.7% 27.7% 15.8% 0.9% 69.1%
2006:
Overseas sales ¥218,603 ¥206,870 ¥113,482 ¥8,829 ¥547,784
Consolidated sales ¥806,900
Ratio of overseas sales to consolidated sales 27.1% 25.6% 14.1% 1.1% 67.9%
2005:
Overseas sales ¥204,650 ¥235,411 ¥119,578 ¥7,926 ¥567,565
Consolidated sales ¥840,591
Ratio of overseas sales to consolidated sales 24.4% 28.0% 14.2% 0.9% 67.5%
Thousands of U.S. dollars
Americas Europe Asia Other areas Total
2007:
Overseas sales $1,555,186 $1,740,771 $993,568 $58,839 $4,348,364
Consolidated sales $6,293,949
Ratio of overseas sales to consolidated sales 24.7% 27.7% 15.8% 0.9% 69.1%
52