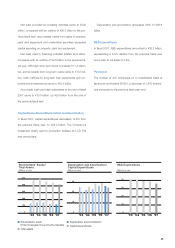
JVC 2007 Annual Report Download - page 40
Download and view the complete annual report
Please find page 40 of the 2007 JVC annual report below. You can navigate through the pages in the report by either clicking on the pages listed below, or by using the keyword search tool below to find specific information within the annual report.-
 1
1 -
2
-
3
-
4
-
5
-
6
-
7
-
8
-
9
-
10
-
11
-
12
-
13
-
14
-
15
-
16
-
17
-
18
-
19
-
20
-
21
-
22
-
23
-
24
-
25
-
26
-
27
-
28
-
29
-
 30
30 -
 31
31 -
 32
32 -
 33
33 -
 34
34 -
 35
35 -
 36
36 -
 37
37 -
 38
38 -
 39
39 -
 40
40 -
 41
41 -
 42
42 -
 43
43 -
 44
44 -
 45
45 -
 46
46 -
 47
47 -
 48
48 -
 49
49 -
 50
50 -
51
-
52
-
53
-
54
-
55
-
56
-
57
-
58
-
59
-
60
 |
 |

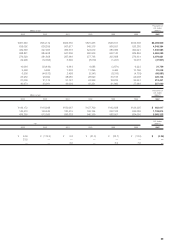
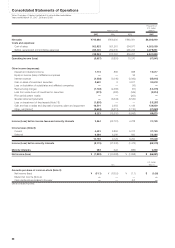
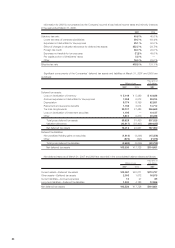
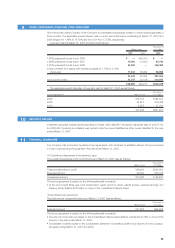
38
Thousands of
U.S. dollars
Millions of yen (Note 1)
2007 2006 2005 2007
Cash flows from operating activities:
Income (Loss) before income taxes and minority interests ¥2,564 ¥(22,101) ¥04,728 $21,729
Depreciation 23,340 24,044 21,952 197,797
Loss on impairment of fixed assets 1,805 ——15,297
Interest and dividend income (1,772) (886) (688) (15,017)
Interest expense 4,238 3,040 3,092 35,915
Increase (Decrease) in accrued restructuring charges ——(3,136) —
Gain on sales of investment securities (3,620) (2) (3,911) (30,678)
Gain on sales of property, plant and equipment (17,225) (3,193) (1,949) (145,975)
Decrease (Increase) in notes and accounts receivable 5,058 10,466 1,313 42,864
Decrease (Increase) in inventories 19,670 11,759 8,083 166,695
Increase (Decrease) in notes and accounts payable (14,154) 5,041 (22,478) (119,949)
Other (780) 2,088 (5,336) (6,610)
Sub-total 19,124 30,256 1,670 162,068
Interest and dividends received 1,772 886 700 15,017
Interest paid (4,240) (3,017) (3,108) (35,932)
Income taxes paid (4,563) (4,535) (5,495) (38,669)
Net cash provided by (used in) operating activities 12,093 23,590 (6,233) 102,484
Cash flows from investing activities:
Purchases of time deposits ——(50) —
Withdrawal of time deposits ——4,155 —
Purchases of property, plant and equipment (21,460) (27,525) (26,849) (181,864)
Proceeds from sales of property, plant and equipment 18,844 6,517 5,199 159,695
Purchases of investment securities (24) (52) (114) (203)
Proceeds from sales of investment securities 5,242 36 5,541 44,424
Payments for investments in subsidiaries —(278) — —
Proceeds from sales of investment in subsidiaries results
in change in scope of consolidation 593 —— 5,025
Other (2,790) (4,018) (1,744) (23,645)
Net cash provided by (used in) investing activities 405 (25,320) (13,862) 3,432
Cash flows from financing activities:
Proceeds from long-term loans 13,500 30,000 — 114,407
Repayments of long-term loans (32,443) (20,133) (5,987) (274,941)
Proceeds from issuance of bonds 19,902 ——168,661
Redemption of bonds (20,000) (36,120) (10,968) (169,492)
Increase in short-term bank loans, net 11,311 25,995 3,673 95,856
Cash dividends paid —(1,270) (1,629) —
Proceeds from the stock lending 3,617 ——30,653
Other (836) (1,283) (703) (7,085)
Net cash provided by (used in) financing activities (4,949) (2,811) (15,614) (41,941)
Effect of exchange rate changes on cash and cash equivalents 2,075 1,983 879 17,584
Net increase (decrease) in cash and cash equivalents 9,624 (2,558) (34,830) 81,559
Cash and cash equivalents at beginning of the year 60,127 62,685 97,242 509,551
Effect of changes in the number of consolidated subsidiaries
and companies accounted for by the equity method 272 —273 2,305
Cash and cash equivalents at end of the year ¥70,023 ¥60,127 ¥62,685 $593,415
See accompanying notes.
Consolidated Statements of Cash Flows
Victor Company of Japan, Limited and its consolidated subsidiaries
Years ended March 31, 2007, 2006 and 2005