JVC 2007 Annual Report Download - page 39
Download and view the complete annual report
Please find page 39 of the 2007 JVC annual report below. You can navigate through the pages in the report by either clicking on the pages listed below, or by using the keyword search tool below to find specific information within the annual report.-
 1
1 -
2
-
3
-
4
-
5
-
6
-
7
-
8
-
9
-
10
-
11
-
12
-
13
-
14
-
15
-
16
-
17
-
18
-
19
-
20
-
21
-
22
-
23
-
24
-
25
-
26
-
27
-
28
-
 29
29 -
 30
30 -
 31
31 -
 32
32 -
 33
33 -
 34
34 -
 35
35 -
 36
36 -
 37
37 -
 38
38 -
 39
39 -
 40
40 -
 41
41 -
 42
42 -
 43
43 -
 44
44 -
 45
45 -
 46
46 -
 47
47 -
 48
48 -
 49
49 -
50
-
51
-
52
-
53
-
54
-
55
-
56
-
57
-
58
-
59
-
60
 |
 |

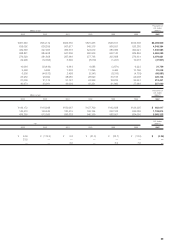
37
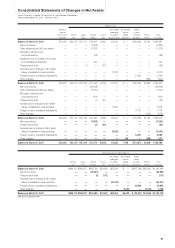
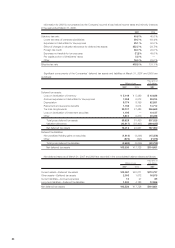
Millions of yen
Number of Net unrealized Net unrealized Foreign
shares of holding gains gains on currency
common stock Common Capital Retained Treasury on available- hedging translation Minority Total
(Thousands) stock surplus earnings stock for-sale securities derivatives adjustments interests net assets
Balance at March 31, 2004 254,230 ¥34,115 ¥67,217 ¥79,622 ¥(141) ¥4,743 ¥ — ¥(26,230) ¥4,161 ¥163,487
Net income (loss) — — — (1,858) — — — — — (1,858)
Cash dividends paid (¥5.0 per share) — — — (1,270) — — — — — (1,270)
Bonuses to directors and
corporate auditors — — — (88) — — — — — (88)
Adjustment due to change in the scope
of consolidated subsidiaries — — — 740 — — — — — 740
Treasury stock (net) — — (1) — (37) — — — — (38)
Decrease due to changes in fair market
values of available-for-sale securities — — — — — (1,372) — — — (1,372)
Foreign currency translation adjustments — — — — — — — 2,796 — 2,796
Other changes — — — — — — — — (297) (297)
Balance at March 31, 2005 254,230 ¥34,115 ¥67,216 ¥77,146 ¥(178) ¥3,371 ¥ — ¥(23,434) ¥3,864 ¥162,100
Net income (loss) — — — (30,608) — — — — — (30,608)
Cash dividends paid (¥5.0 per share) — — — (1,270) — — — — — (1,270)
Bonuses to directors and
corporate auditors — — — (101) — — — — — (101)
Treasury stock (net) — — — (1) (21) — — — — (22)
Increase due to changes in fair market
values of available-for-sale securities — — — — — 2,876 — — — 2,876
Foreign currency translation adjustments — — — — — — — 7,178 — 7,178
Other changes — — — — — — — — (679) (679)
Balance at March 31, 2006 254,230 ¥34,115 ¥67,216 ¥45,166 ¥(199) ¥6,247 ¥ — ¥(16,256) ¥3,185 ¥139,474
Net income (loss) ———(7,892) — — — — — (7,892)
Treasury stock (net) ———(0) (20) — — — — (20)
Decrease due to changes in fair market
values of available-for-sale securities —————(3,592) — — — (3,592)
Foreign currency translation adjustments ———————5,289 — 5,289
Other changes ——————766 — (239) 527
Balance at March 31, 2007 254,230 ¥34,115 ¥67,216 ¥37,274 ¥(219) ¥2,655 ¥766 ¥(10,967) ¥2,946 ¥133,786
Thousands of U.S. dollars (Note 1)
Net unrealized Net unrealized Foreign
holding gains gains on currency
Common Capital Retained Treasury on available- hedging translation Minority Total
stock surplus earnings stock for-sale securities derivatives adjustments interests net assets
Balance at March 31, 2006 $289,110 $569,627 $382,763 $(1,686) $52,941 $ — $(137,763) $26,992 $1,181,984
Net income (loss) ——(66,881) — — — — — (66,881)
Treasury stock (net) —— (0) (171) — — — — (171)
Decrease due to changes in fair market
values of available-for-sale securities —— ——(30,441) — — — (30,441)
Foreign currency translation adjustments —— ————44,822 — 44,822
Other changes —— —— —6,492 — (2,026) 4,466
Balance at March 31, 2007 $289,110 $569,627 $315,882 $(1,857) $22,500 $6,492 $ (92,941) $24,966 $1,133,779
See accompanying notes.
Consolidated Statements of Changes in Net Assets
Victor Company of Japan, Limited and its consolidated subsidiaries
Years ended March 31, 2007, 2006 and 2005