JVC 2007 Annual Report Download - page 53
Download and view the complete annual report
Please find page 53 of the 2007 JVC annual report below. You can navigate through the pages in the report by either clicking on the pages listed below, or by using the keyword search tool below to find specific information within the annual report.-
 1
1 -
2
-
3
-
4
-
5
-
6
-
7
-
8
-
9
-
10
-
11
-
12
-
13
-
14
-
15
-
16
-
17
-
18
-
19
-
20
-
21
-
22
-
23
-
24
-
25
-
26
-
27
-
28
-
29
-
30
-
31
-
32
-
33
-
34
-
35
-
36
-
37
-
38
-
39
-
40
-
41
-
42
-
 43
43 -
 44
44 -
 45
45 -
 46
46 -
 47
47 -
 48
48 -
 49
49 -
 50
50 -
 51
51 -
 52
52 -
 53
53 -
 54
54 -
 55
55 -
 56
56 -
 57
57 -
 58
58 -
 59
59 -
 60
60
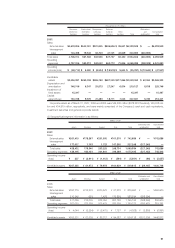
 |
 |

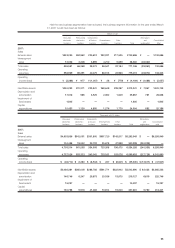
Thousands of U.S. dollars
Consumer Professional Components Software Eliminations
electronics electronics & Devices & Media Other and Consolidated
business business business business business Total unallocation total
2007:
Sales
External sales $4,603,856 $542,051 $301,805 $806,636 $039,601 $6,293,949 $ — $6,293,949
Intersegment
sales 104,458 19,542 32,703 41,101 42,849 240,653 (240,653) —
Total sales 4,708,314 561,593 334,508 847,737 82,450 6,534,602 (240,653) 6,293,949
Operating
expenses 4,737,026 553,313 343,042 863,712 72,806 6,569,899 (228,009) 6,341,890
Operating
income (loss) $(28,712) $008,280 $ (8,534) $ (15,975) $009,644 $ (35,297) $ (12,644) $ (47,941)
Identifiable
assets $2,036,381 $265,008 $286,788 $697,220 $217,866 $3,503,263 $062,060 $3,565,323
Depreciation and
amortization 146,746 8,347 29,873 27,347 6,814 219,127 6,619 225,746
Impairment of
fixed assets 15,297 — — — — 15,297 — 15,297
Capital
expenditures 130,788 9,576 41,483 18,771 7,043 207,661 5,780 213,441
Corporate assets as of March 31, 2007, 2006 and 2005 were ¥44,630 million ($378,220 thousand), ¥53,918 mil-
lion and ¥54,919 million, respectively, and were mainly comprised of the Company’s cash and cash equivalents,
investment securities and general corporate assets.
(2) Geographical segment information is as follows:
Millions of yen
Elimination and Consolidated
Japan Americas Europe Asia Total unallocation total
2007:
Sales
External sales ¥261,415 ¥178,387 ¥201,505 ¥101,379 ¥0,742,686 ¥ — ¥742,686
Intersegment
sales 177,017 1,153 1,723 147,355 327,248 (327,248) —
Total sales 438,432 179,540 203,228 248,734 1,069,934 (327,248) 742,686
Operating expenses 438,105 183,451 204,641 249,298 1,075,495 (327,152) 748,343
Operating income
(loss) ¥000,327 ¥ (3,911) ¥ (1,413) ¥ (564) ¥ (5,561) ¥ (96) ¥ (5,657)
Identifiable assets ¥267,235 ¥061,973 ¥079,978 ¥100,629 ¥0,509,815 ¥ (89,107) ¥420,708
Millions of yen
Elimination and Consolidated
Japan Americas Europe Asia Total unallocation total
2006:
Sales
External sales ¥300,719 ¥214,372 ¥200,576 ¥091,233 ¥0,806,900 ¥ — ¥806,900
Intersegment
sales 210,340 633 1,428 175,893 388,294 (388,294) —
Total sales 511,059 215,005 202,004 267,126 1,195,194 (388,294) 806,900
Operating expenses 507,015 221,359 205,479 265,369 1,199,222 (385,431) 813,791
Operating income
(loss) ¥004,044 ¥ (6,354) ¥ (3,475) ¥001,757 ¥ (4,028) ¥00(2,863) ¥ (6,891)
Identifiable assets ¥305,311 ¥067,503 ¥086,717 ¥094,587 ¥0,554,118 ¥(107,306) ¥446,812
51