JVC 2007 Annual Report Download - page 52
Download and view the complete annual report
Please find page 52 of the 2007 JVC annual report below. You can navigate through the pages in the report by either clicking on the pages listed below, or by using the keyword search tool below to find specific information within the annual report.-
 1
1 -
2
-
3
-
4
-
5
-
6
-
7
-
8
-
9
-
10
-
11
-
12
-
13
-
14
-
15
-
16
-
17
-
18
-
19
-
20
-
21
-
22
-
23
-
24
-
25
-
26
-
27
-
28
-
29
-
30
-
31
-
32
-
33
-
34
-
35
-
36
-
37
-
38
-
39
-
40
-
41
-
 42
42 -
 43
43 -
 44
44 -
 45
45 -
 46
46 -
 47
47 -
 48
48 -
 49
49 -
 50
50 -
 51
51 -
 52
52 -
 53
53 -
 54
54 -
 55
55 -
 56
56 -
 57
57 -
 58
58 -
 59
59 -
 60
60
 |
 |

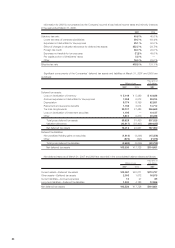
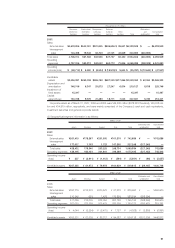
Millions of yen
Consumer Professional Components Software Eliminations
electronics electronics & Devices & Media Other and Consolidated
business business business business business Total unallocation total
2006:
Sales
External sales ¥600,397 ¥67,563 ¥30,248 ¥103,943 ¥04,749 ¥806,900 ¥ — ¥806,900
Intersegment
sales 13,411 1,305 4,140 6,738 5,000 30,594 (30,594) —
Total sales 613,808 68,868 34,388 110,681 9,749 837,494 (30,594) 806,900
Operating
expenses 623,364 68,148 34,277 108,116 9,278 843,183 (29,392) 813,791
Operating
income (loss) ¥ (9,556) ¥00,720 ¥00,111 ¥002,565 ¥00,471 ¥ (5,689) ¥ (1,202) ¥ (6,891)
Identifiable assets ¥280,485 ¥36,846 ¥26,298 ¥084,828 ¥24,779 ¥453,236 ¥ (6,424) ¥446,812
Depreciation and
amortization 17,908 860 2,905 3,584 853 26,110 738 26,848
Capital
expenditures 20,781 1,140 3,314 2,854 602 28,691 799 29,490
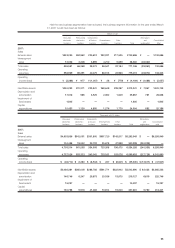
Millions of yen
Consumer Professional Components Software Eliminations
electronics electronics & Devices & Media Other and Consolidated
business business business business business Total unallocation total
2005:
Sales
External sales ¥627,286 ¥68,348 ¥43,150 ¥095,928 ¥05,879 ¥840,591 ¥ — ¥840,591
Intersegment
sales 3,520 2,221 2,107 6,788 3,782 18,418 (18,418) —
Total sales 630,806 70,569 45,257 102,716 9,661 859,009 (18,418) 840,591
Operating
expenses 620,424 70,282 46,990 100,339 9,337 847,372 (17,151) 830,221
Operating
income (loss) ¥010,382 ¥00,287 ¥ (1,733) ¥002,377 ¥00,324 ¥ 11,637 ¥ (1,267) ¥010,370
Identifiable assets ¥293,932 ¥37,675 ¥26,817 ¥082,532 ¥24,077 ¥465,033 ¥01,516 ¥466,549
Depreciation and
amortization 15,223 885 2,959 3,682 479 23,228 194 23,422
Capital
expenditures 20,749 937 3,272 3,794 172 28,924 35 28,959
50