JVC 2007 Annual Report Download - page 51
Download and view the complete annual report
Please find page 51 of the 2007 JVC annual report below. You can navigate through the pages in the report by either clicking on the pages listed below, or by using the keyword search tool below to find specific information within the annual report.-
 1
1 -
2
-
3
-
4
-
5
-
6
-
7
-
8
-
9
-
10
-
11
-
12
-
13
-
14
-
15
-
16
-
17
-
18
-
19
-
20
-
21
-
22
-
23
-
24
-
25
-
26
-
27
-
28
-
29
-
30
-
31
-
32
-
33
-
34
-
35
-
36
-
37
-
38
-
39
-
40
-
 41
41 -
 42
42 -
 43
43 -
 44
44 -
 45
45 -
 46
46 -
 47
47 -
 48
48 -
 49
49 -
 50
50 -
 51
51 -
 52
52 -
 53
53 -
 54
54 -
 55
55 -
 56
56 -
 57
57 -
 58
58 -
 59
59 -
 60
60
 |
 |
49
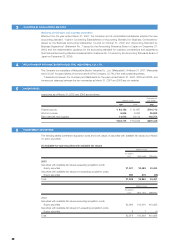
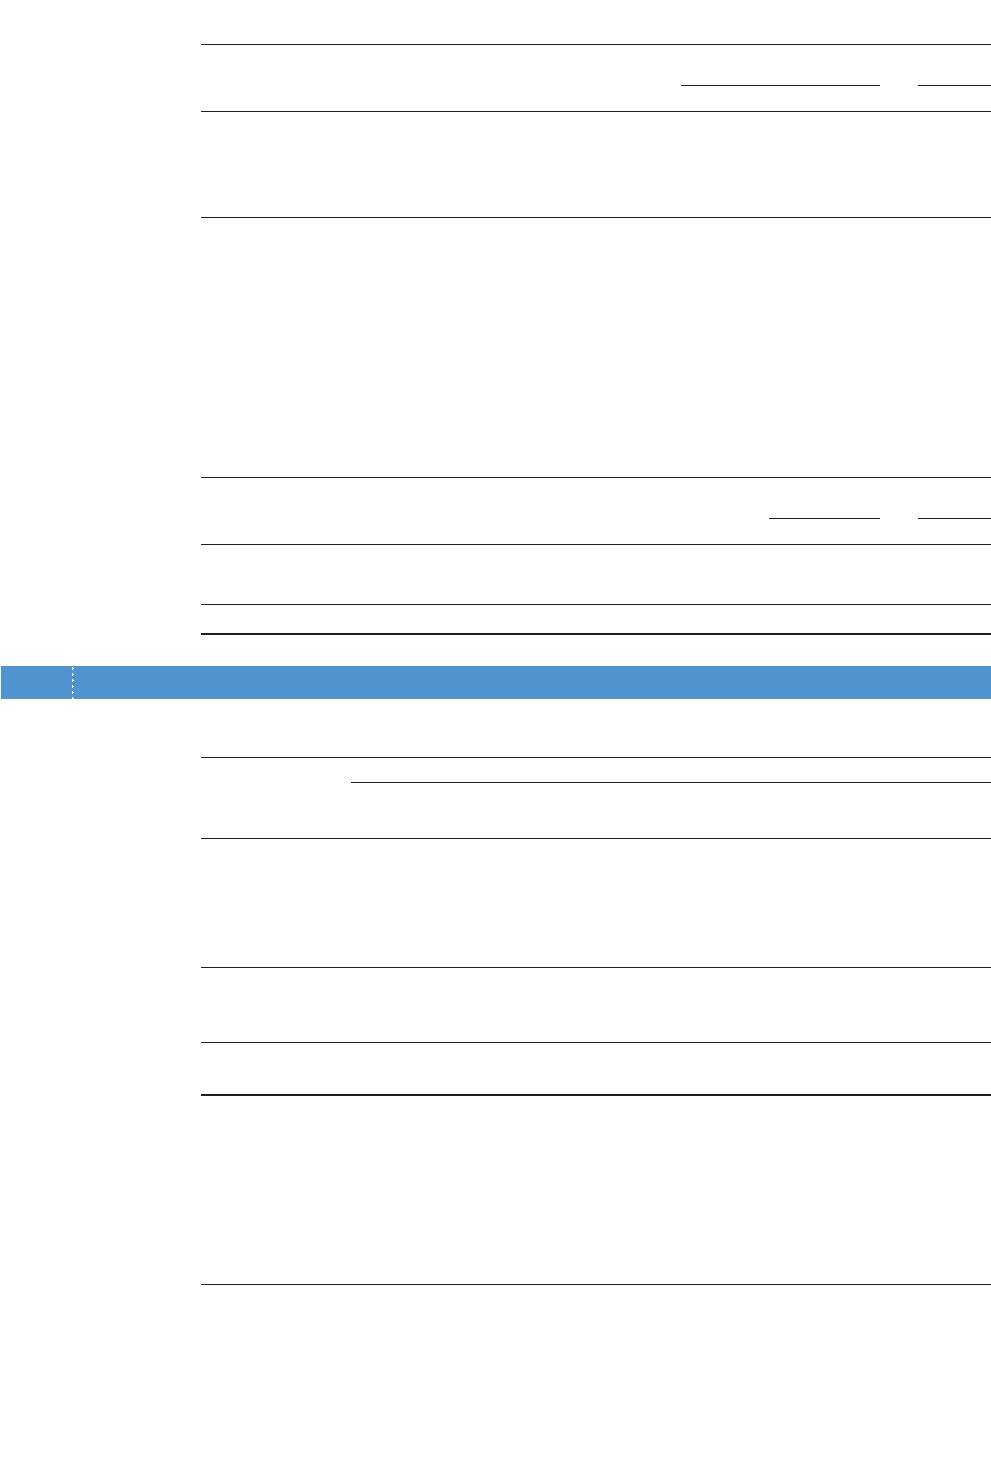
(3) Lease payments, assumed depreciation charges, assumed interest charges and impairment losses for the
years ended March 31, 2007, 2006 and 2005 are as follows:
Thousands of
Millions of yen U.S. dollars
2007 2006 2005 2007
Lease payments ¥3,535 ¥3,281 ¥3,790 $29,958
Assumed depreciation charges 2,986 2,850 3,381 25,305
Assumed interest charges 383 206 277 3,246
Impairment losses 58 —— 492
(4) Assumed depreciation charges are computed using the straight-line method over lease terms assuming no
residual value.
(5) The excess amount of total lease payments over acquisition cost of leased property is deemed as accumulated
interest expenses and allocated for each period on the basis of the interest method.
Lessor:
The Companies lease certain equipment under non-capitalized finance leases, as lessees. And the Companies
lease those equipment under non-capitalized finance leases, as lessors. Future minimum lease receipts under
these non-capitalized finance leases at March 31, 2007 and 2006 are as follows:
Thousands of
Millions of yen U.S. dollars
Non-capitalized finance leases 2007 2006 2007
Due within one year ¥054 ¥106 $0,458
Due after one year 156 232 1,322
¥210 ¥338 $1,780
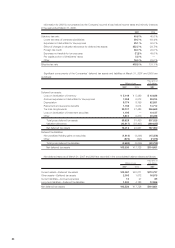
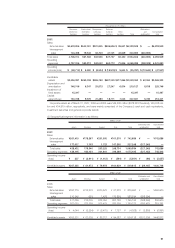
17 SEGMENT INFORMATION
Information by segment for the years ended March 31, 2007, 2006 and 2005 is shown in the tables below.
(1) Business segment information is as follows:
Millions of yen
Consumer Professional Components Software Eliminations
electronics electronics & Devices & Media Other and Consolidated
business business business business business Total unallocation total
2007:
Sales
External sales ¥543,255 ¥63,962 ¥35,613 ¥095,183 ¥04,673 ¥742,686 ¥ — ¥742,686
Intersegment
sales 12,326 2,306 3,859 4,850 5,056 28,397 (28,397) —
Total sales 555,581 66,268 39,472 100,033 9,729 771,083 (28,397) 742,686
Operating
expenses 558,969 65,291 40,479 101,918 8,591 775,248 (26,905) 748,343
Operating
income (loss) ¥(3,388) ¥00,977 ¥ (1,007) ¥ (1,885) ¥01,138 ¥ (4,165) ¥ (1,492) ¥ (5,657)
Identifiable assets ¥240,293 ¥31,271 ¥33,841 ¥ 82,272 ¥25,708 ¥413,385 ¥07,323 ¥420,708
Depreciation and
amortization 17,316 985 3,525 3,227 804 25,857 781 26,638
Impairment of
fixed assets 1,805 — — — — 1,805 — 1,805
Capital
expenditures 15,433 1,130 4,895 2,215 831 24,504 682 25,186