Hasbro 2012 Annual Report Download - page 97
Download and view the complete annual report
Please find page 97 of the 2012 Hasbro annual report below. You can navigate through the pages in the report by either clicking on the pages listed below, or by using the keyword search tool below to find specific information within the annual report.-
 1
1 -
2
-
3
-
4
-
5
-
6
-
7
-
8
-
9
-
10
-
11
-
12
-
13
-
14
-
15
-
16
-
17
-
18
-
19
-
20
-
21
-
22
-
23
-
24
-
25
-
26
-
27
-
28
-
29
-
30
-
31
-
32
-
33
-
34
-
35
-
36
-
37
-
38
-
39
-
40
-
41
-
42
-
43
-
44
-
45
-
46
-
47
-
48
-
49
-
50
-
51
-
52
-
53
-
54
-
55
-
56
-
57
-
58
-
59
-
60
-
61
-
62
-
63
-
64
-
65
-
66
-
67
-
68
-
69
-
70
-
71
-
72
-
73
-
74
-
75
-
76
-
77
-
78
-
79
-
80
-
81
-
82
-
83
-
84
-
85
-
86
-
 87
87 -
 88
88 -
 89
89 -
 90
90 -
 91
91 -
 92
92 -
 93
93 -
 94
94 -
 95
95 -
 96
96 -
 97
97 -
 98
98 -
 99
99 -
 100
100 -
 101
101 -
 102
102 -
 103
103 -
 104
104 -
 105
105 -
 106
106 -
 107
107 -
108
-
109
-
110
-
111
-
112
 |
 |

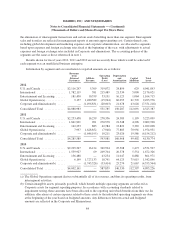
HASBRO, INC. AND SUBSIDIARIES
Notes to Consolidated Financial Statements — (Continued)
(Thousands of Dollars and Shares Except Per Share Data)
(20) Quarterly Financial Data (Unaudited)
Quarter
First Second Third Fourth Full Year
2012
Net revenues ............................ $648,850 811,467 1,345,137 1,283,529 4,088,983
Operating profit .......................... 15,726 86,282 249,622 200,155 551,785
Earnings (loss) before income taxes .......... (4,866) 59,659 224,949 173,660 453,402
Net earnings (loss) ........................ (2,579) 43,427 164,852 130,299 335,999
Per common share
Net earnings (loss)
Basic .............................. $ (0.02) 0.33 1.26 1.00 2.58
Diluted ............................. (0.02) 0.33 1.24 0.99 2.55
Market price
High ............................... $ 37.70 37.55 39.98 39.96 39.98
Low ............................... 31.51 32.00 32.29 34.91 31.51
Cash dividends declared ................. $ 0.36 0.36 0.36 0.36 1.44
Quarter
First Second Third Fourth Full Year
2011
Net revenues ............................ $671,986 908,454 1,375,811 1,329,338 4,285,589
Operating profit .......................... 48,923 80,407 248,072 216,579 593,981
Earnings before income taxes ............... 22,838 52,954 221,457 189,144 486,393
Net earnings ............................. 17,196 58,051 170,990 139,130 385,367
Per common share
Net earnings
Basic .............................. $ 0.12 0.43 1.29 1.08 2.88
Diluted ............................. 0.12 0.42 1.27 1.06 2.82
Market price
High ............................... $ 48.70 48.43 46.01 39.20 48.70
Low ............................... 42.54 42.63 33.21 31.36 31.36
Cash dividends declared ................. $ 0.30 0.30 0.30 0.30 1.20
87