Hasbro 2012 Annual Report Download - page 71
Download and view the complete annual report
Please find page 71 of the 2012 Hasbro annual report below. You can navigate through the pages in the report by either clicking on the pages listed below, or by using the keyword search tool below to find specific information within the annual report.-
 1
1 -
2
-
3
-
4
-
5
-
6
-
7
-
8
-
9
-
10
-
11
-
12
-
13
-
14
-
15
-
16
-
17
-
18
-
19
-
20
-
21
-
22
-
23
-
24
-
25
-
26
-
27
-
28
-
29
-
30
-
31
-
32
-
33
-
34
-
35
-
36
-
37
-
38
-
39
-
40
-
41
-
42
-
43
-
44
-
45
-
46
-
47
-
48
-
49
-
50
-
51
-
52
-
53
-
54
-
55
-
56
-
57
-
58
-
59
-
60
-
 61
61 -
 62
62 -
 63
63 -
 64
64 -
 65
65 -
 66
66 -
 67
67 -
 68
68 -
 69
69 -
 70
70 -
 71
71 -
 72
72 -
 73
73 -
 74
74 -
 75
75 -
 76
76 -
 77
77 -
 78
78 -
 79
79 -
 80
80 -
 81
81 -
82
-
83
-
84
-
85
-
86
-
87
-
88
-
89
-
90
-
91
-
92
-
93
-
94
-
95
-
96
-
97
-
98
-
99
-
100
-
101
-
102
-
103
-
104
-
105
-
106
-
107
-
108
-
109
-
110
-
111
-
112
 |
 |

HASBRO, INC. AND SUBSIDIARIES
Notes to Consolidated Financial Statements — (Continued)
(Thousands of Dollars and Shares Except Per Share Data)
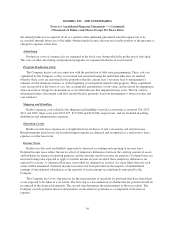
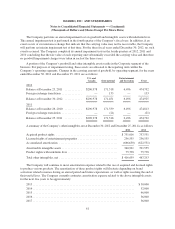
The Company performs an annual impairment test on goodwill and intangible assets with indefinite lives.
This annual impairment test is performed in the fourth quarter of the Company’s fiscal year. In addition, if an
event occurs or circumstances change that indicate that the carrying value may not be recoverable, the Company
will perform an interim impairment test at that time. For the three fiscal years ended December 30, 2012, no such
events occurred. The Company completed its annual impairment tests in the fourth quarters of 2012, 2011 and
2010 concluding that the fair value of each reporting unit substantially exceeded the carrying value and therefore,
no goodwill impairment charges were taken in each of the three years.
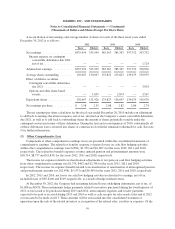
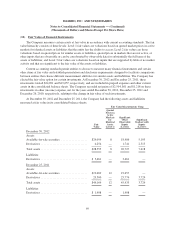
A portion of the Company’s goodwill and other intangible assets reside in the Corporate segment of the
business. For purposes of impairment testing, these assets are allocated to the reporting units within the
Company’s operating segments. Changes in the carrying amount of goodwill, by operating segment, for the years
ended December 30, 2012 and December 25, 2011 are as follows:
U.S. and
Canada International
Entertainment
and Licensing Total
2012
Balance at December 25, 2011 ............ $296,978 171,318 6,496 474,792
Foreign exchange translation .............. — 133 — 133
Balance at December 30, 2012 ............ $296,978 171,451 6,496 474,925
2011
Balance at December 26, 2010 ............ $296,978 171,339 6,496 474,813
Foreign exchange translation .............. — (21) — (21)
Balance at December 25, 2011 ............ $296,978 171,318 6,496 474,792
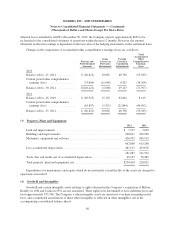
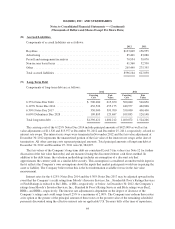
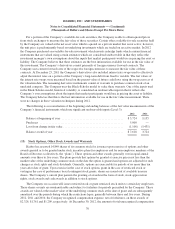
A summary of the Company’s other intangibles, net at December 30, 2012 and December 25, 2011 is as follows:
2012 2011
Acquired product rights .......................................... $751,016 757,531
Licensed rights of entertainment properties ........................... 256,555 256,555
Accumulated amortization ........................................ (666,650) (622,531)
Amortizable intangible assets ...................................... 340,921 391,555
Product rights with indefinite lives .................................. 75,738 75,738
Total other intangibles, net ........................................ $416,659 467,293
The Company will continue to incur amortization expense related to the use of acquired and licensed rights
to produce various products. The amortization of these product rights will fluctuate depending on brand
activation related revenues during an annual period and future expectations, as well as rights reaching the end of
their useful lives. The Company currently estimates amortization expense related to the above intangible assets
for the next five years to be approximately:
2013 ..................................................................... $50,000
2014 ..................................................................... 52,000
2015 ..................................................................... 46,000
2016 ..................................................................... 36,000
2017 ..................................................................... 36,000
61