Hasbro 2012 Annual Report Download - page 35
Download and view the complete annual report
Please find page 35 of the 2012 Hasbro annual report below. You can navigate through the pages in the report by either clicking on the pages listed below, or by using the keyword search tool below to find specific information within the annual report.-
 1
1 -
2
-
3
-
4
-
5
-
6
-
7
-
8
-
9
-
10
-
11
-
12
-
13
-
14
-
15
-
16
-
17
-
18
-
19
-
20
-
21
-
22
-
23
-
24
-
 25
25 -
 26
26 -
 27
27 -
 28
28 -
 29
29 -
 30
30 -
 31
31 -
 32
32 -
 33
33 -
 34
34 -
 35
35 -
 36
36 -
 37
37 -
 38
38 -
 39
39 -
 40
40 -
 41
41 -
 42
42 -
 43
43 -
 44
44 -
 45
45 -
46
-
47
-
48
-
49
-
50
-
51
-
52
-
53
-
54
-
55
-
56
-
57
-
58
-
59
-
60
-
61
-
62
-
63
-
64
-
65
-
66
-
67
-
68
-
69
-
70
-
71
-
72
-
73
-
74
-
75
-
76
-
77
-
78
-
79
-
80
-
81
-
82
-
83
-
84
-
85
-
86
-
87
-
88
-
89
-
90
-
91
-
92
-
93
-
94
-
95
-
96
-
97
-
98
-
99
-
100
-
101
-
102
-
103
-
104
-
105
-
106
-
107
-
108
-
109
-
110
-
111
-
112
 |
 |

On May 19, 2011, the Company announced that its Board of Directors authorized the repurchase of an
additional $500 million in common stock. Purchases of the Company’s common stock may be made from time to
time, subject to market conditions. These shares may be repurchased in the open market or through privately
negotiated transactions. The Company has no obligation to repurchase shares under the authorization, and the
timing, actual number, and value of the shares that are repurchased, if any, will depend on a number of factors,
including the price of the Company’s stock. The Company may suspend or discontinue the program at any time
and there is no expiration date.
In November 2012, the Company repurchased an aggregate of 458,200 shares in connection with the
exercises of stock options, which shares were delivered by the award recipient as payment of the exercise price
and related taxes. These shares were purchased at the market prices on the dates of the exercises of the stock
options.
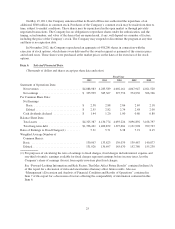
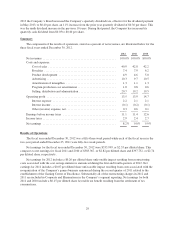
Item 6. Selected Financial Data.
(Thousands of dollars and shares except per share data and ratios)
Fiscal Year
2012 2011 2010 2009 2008
Statement of Operations Data:
Net revenues ........................... $4,088,983 4,285,589 4,002,161 4,067,947 4,021,520
Net earnings ............................ $ 335,999 385,367 397,752 374,930 306,766
Per Common Share Data:
Net Earnings
Basic ............................... $ 2.58 2.88 2.86 2.69 2.18
Diluted .............................. $ 2.55 2.82 2.74 2.48 2.00
Cash dividends declared .................. $ 1.44 1.20 1.00 0.80 0.80
Balance Sheet Data:
Total assets ............................ $4,325,387 4,130,774 4,093,226 3,896,892 3,168,797
Total long-term debt ..................... $1,396,421 1,400,872 1,397,681 1,131,998 709,723
Ratio of Earnings to Fixed Charges(1) ......... 5.31 5.71 6.38 7.91 8.15
Weighted Average Number of
Common Shares:
Basic ................................. 130,067 133,823 139,079 139,487 140,877
Diluted ................................ 131,926 136,697 145,670 152,780 155,230
(1) For purposes of calculating the ratio of earnings to fixed charges, fixed charges include interest expense and
one-third of rentals; earnings available for fixed charges represent earnings before income taxes, less the
Company’s share of earnings (losses) from equity investees plus fixed charges.
See “Forward-Looking Information and Risk Factors That May Affect Future Results” contained in Item 1A
of this report for a discussion of risks and uncertainties that may affect future results. Also see
“Management’s Discussion and Analysis of Financial Condition and Results of Operations” contained in
Item 7 of this report for a discussion of factors affecting the comparability of information contained in this
Item 6.
25