Hasbro 2012 Annual Report Download - page 48
Download and view the complete annual report
Please find page 48 of the 2012 Hasbro annual report below. You can navigate through the pages in the report by either clicking on the pages listed below, or by using the keyword search tool below to find specific information within the annual report.-
 1
1 -
2
-
3
-
4
-
5
-
6
-
7
-
8
-
9
-
10
-
11
-
12
-
13
-
14
-
15
-
16
-
17
-
18
-
19
-
20
-
21
-
22
-
23
-
24
-
25
-
26
-
27
-
28
-
29
-
30
-
31
-
32
-
33
-
34
-
35
-
36
-
37
-
 38
38 -
 39
39 -
 40
40 -
 41
41 -
 42
42 -
 43
43 -
 44
44 -
 45
45 -
 46
46 -
 47
47 -
 48
48 -
 49
49 -
 50
50 -
 51
51 -
 52
52 -
 53
53 -
 54
54 -
 55
55 -
 56
56 -
 57
57 -
 58
58 -
59
-
60
-
61
-
62
-
63
-
64
-
65
-
66
-
67
-
68
-
69
-
70
-
71
-
72
-
73
-
74
-
75
-
76
-
77
-
78
-
79
-
80
-
81
-
82
-
83
-
84
-
85
-
86
-
87
-
88
-
89
-
90
-
91
-
92
-
93
-
94
-
95
-
96
-
97
-
98
-
99
-
100
-
101
-
102
-
103
-
104
-
105
-
106
-
107
-
108
-
109
-
110
-
111
-
112
 |
 |
decision by the Company’s Board to accelerate the payment of the dividend declared in December 2012, which
historically would have been paid in February 2013, to December 2012. In addition, the decrease relates to a
decrease in accrued royalties as the result of lower sales of entertainment-based products as well as lower
accrued non-income-based taxes. These lower balances were partially offset by severance costs accrued in the
fourth quarter of 2012 as well as higher accrued payroll and management incentives. Accounts payable and
accrued expenses increased to $761,914 at December 25, 2011 compared $704,233 at December 26, 2010. The
2011 balance included a decrease of approximately $15,100 as a result of the translation of foreign currency
balances. The increases in accrued expenses related to higher accrued royalties as a result of increased sales of
royalty-bearing BEYBLADE and TRANSFORMERS products in 2011. The remainder of the increase related to
higher accrued costs associated with cancelled purchase commitments and accrued income and other taxes. These
increases were partially offset by lower accrued payroll and management incentives.
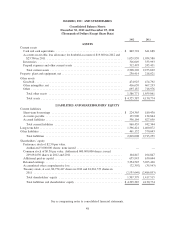
Other liabilities increased to $461,152 at December 30, 2012 from $370,043 at December 25, 2011 and
$361,324 at December 26, 2010. Increased non-current liabilities are primarily the result of higher pension
liabilities at December 30, 2012 compared to 2011 and 2010. Further, other liabilities associated with uncertain
tax positions increase in 2012 as compared to 2011.
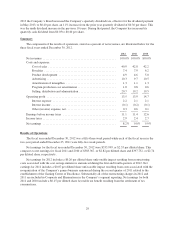
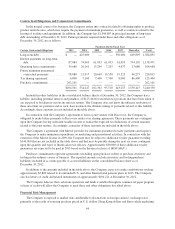
Cash flows utilized by investing activities were $106,172, $107,615 and $104,188 in 2012, 2011 and 2010,
respectively, which consisted primarily of additions to property, plant and equipment of approximately $112,100,
$99,400 and $112,600 in 2012, 2011 and 2010, respectively. Of these additions, 45% in 2012, 66% in 2011 and
57% in 2010 were for purchases of tools, dies and molds related to the Company’s products. In 2013, the
Company expects capital expenditures to be in the range of $115,000 to $125,000. During the three years ended
December 30, 2012, the depreciation of plant and equipment was $99,718, $113,821 and $95,925, respectively.
Fluctuations in depreciation of plant and equipment correlate with the percentage of additions to property, plant
and equipment relating to tools, dies and molds which have shorter useful lives and accelerated depreciation.
Cash utilized for investments and acquisitions was $11,585 in 2011. No investments and acquisitions were made
in 2012 or 2010. The 2011 utilization represents the Company’s purchase of intellectual property.
The Company commits to inventory production, advertising and marketing expenditures prior to the peak
fourth quarter retail selling season. Accounts receivable increase during the third and fourth quarter as customers
increase their purchases to meet expected consumer demand in their holiday selling season. Due to the
concentrated timeframe of this selling period, payments for these accounts receivable are generally not due until
the fourth quarter or early in the first quarter of the subsequent year. This timing difference between expenditures
and cash collections on accounts receivable makes it necessary for the Company to borrow higher amounts
during the latter part of the year. During 2012 and 2011, the Company primarily used cash from operations and
borrowings under its commercial paper program and available lines of credit. In 2010, the Company primarily
utilized cash from operations and borrowings under its available lines of credit.
During 2010, the Company was party to an accounts receivable securitization program whereby the
Company sold, on an ongoing basis, substantially all of its U.S. trade accounts receivable to a bankruptcy remote
special purpose entity, Hasbro Receivables Funding, LLC (“HRF”). HRF was consolidated with the Company for
financial reporting purposes. The securitization program then allowed HRF to sell, on a revolving basis, an
undivided fractional ownership interest of up to $250,000 in the eligible receivables it held to certain bank
conduits. The program provided the Company with a source of working capital. In January 2011, the Company
terminated this program.
In January 2011, the Company entered into an agreement with a group of banks to establish a commercial
paper program (the “Program”). Under the Program, at the request of the Company and subject to market
conditions, the banks may either purchase from the Company, or arrange for the sale by the Company, of
unsecured commercial paper notes. The Company may issue notes from time to time up to an aggregate principal
amount outstanding at any given time of $500,000. The maturities of the notes may vary but may not exceed 397
days. The notes are sold under customary terms in the commercial paper market and are issued at a discount to
par, or alternatively, sold at par and bear varying interest rates based on a fixed or floating rate basis. The interest
rates vary based on market conditions and the ratings assigned to the notes by the credit rating agencies at the
time of issuance. Borrowings under the Program are supported by the Company’s $700,000 revolving credit
38