Hasbro 2012 Annual Report Download - page 58
Download and view the complete annual report
Please find page 58 of the 2012 Hasbro annual report below. You can navigate through the pages in the report by either clicking on the pages listed below, or by using the keyword search tool below to find specific information within the annual report.-
 1
1 -
2
-
3
-
4
-
5
-
6
-
7
-
8
-
9
-
10
-
11
-
12
-
13
-
14
-
15
-
16
-
17
-
18
-
19
-
20
-
21
-
22
-
23
-
24
-
25
-
26
-
27
-
28
-
29
-
30
-
31
-
32
-
33
-
34
-
35
-
36
-
37
-
38
-
39
-
40
-
41
-
42
-
43
-
44
-
45
-
46
-
47
-
 48
48 -
 49
49 -
 50
50 -
 51
51 -
 52
52 -
 53
53 -
 54
54 -
 55
55 -
 56
56 -
 57
57 -
 58
58 -
 59
59 -
 60
60 -
 61
61 -
 62
62 -
 63
63 -
 64
64 -
 65
65 -
 66
66 -
 67
67 -
 68
68 -
69
-
70
-
71
-
72
-
73
-
74
-
75
-
76
-
77
-
78
-
79
-
80
-
81
-
82
-
83
-
84
-
85
-
86
-
87
-
88
-
89
-
90
-
91
-
92
-
93
-
94
-
95
-
96
-
97
-
98
-
99
-
100
-
101
-
102
-
103
-
104
-
105
-
106
-
107
-
108
-
109
-
110
-
111
-
112
 |
 |

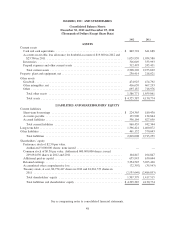
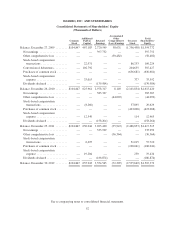
HASBRO, INC. AND SUBSIDIARIES
Consolidated Balance Sheets
December 30, 2012 and December 25, 2011
(Thousands of Dollars Except Share Data)
2012 2011
ASSETS
Current assets
Cash and cash equivalents ............................................. $ 849,701 641,688
Accounts receivable, less allowance for doubtful accounts of $19,600 in 2012 and
$23,700 in 2011 ................................................... 1,029,959 1,034,580
Inventories ......................................................... 316,049 333,993
Prepaid expenses and other current assets ................................. 312,493 243,431
Total current assets ................................................. 2,508,202 2,253,692
Property, plant and equipment, net ......................................... 230,414 218,021
Other assets
Goodwill ........................................................... 474,925 474,792
Other intangibles, net ................................................. 416,659 467,293
Other .............................................................. 695,187 716,976
Total other assets .................................................. 1,586,771 1,659,061
Total assets ....................................................... $4,325,387 4,130,774
LIABILITIES AND SHAREHOLDERS’ EQUITY
Current liabilities
Short-term borrowings ................................................ $ 224,365 180,430
Accounts payable .................................................... 139,906 134,864
Accrued liabilities .................................................... 596,164 627,050
Total current liabilities .............................................. 960,435 942,344
Long-term debt ........................................................ 1,396,421 1,400,872
Other liabilities ........................................................ 461,152 370,043
Total liabilities .................................................... 2,818,008 2,713,259
Shareholders’ equity
Preference stock of $2.50 par value.
Authorized 5,000,000 shares; none issued ............................... — —
Common stock of $0.50 par value. Authorized 600,000,000 shares; issued
209,694,630 shares in 2012 and 2011 .................................. 104,847 104,847
Additional paid-in capital .............................................. 655,943 630,044
Retained earnings .................................................... 3,354,545 3,205,420
Accumulated other comprehensive loss ................................... (72,307) (35,943)
Treasury stock, at cost, 80,754,417 shares in 2012 and 81,061,373 shares in
2011 ............................................................ (2,535,649) (2,486,853)
Total shareholders’ equity ........................................... 1,507,379 1,417,515
Total liabilities and shareholders’ equity ................................ $4,325,387 4,130,774
See accompanying notes to consolidated financial statements.
48