Hasbro 2012 Annual Report Download - page 40
Download and view the complete annual report
Please find page 40 of the 2012 Hasbro annual report below. You can navigate through the pages in the report by either clicking on the pages listed below, or by using the keyword search tool below to find specific information within the annual report.-
 1
1 -
2
-
3
-
4
-
5
-
6
-
7
-
8
-
9
-
10
-
11
-
12
-
13
-
14
-
15
-
16
-
17
-
18
-
19
-
20
-
21
-
22
-
23
-
24
-
25
-
26
-
27
-
28
-
29
-
 30
30 -
 31
31 -
 32
32 -
 33
33 -
 34
34 -
 35
35 -
 36
36 -
 37
37 -
 38
38 -
 39
39 -
 40
40 -
 41
41 -
 42
42 -
 43
43 -
 44
44 -
 45
45 -
 46
46 -
 47
47 -
 48
48 -
 49
49 -
 50
50 -
51
-
52
-
53
-
54
-
55
-
56
-
57
-
58
-
59
-
60
-
61
-
62
-
63
-
64
-
65
-
66
-
67
-
68
-
69
-
70
-
71
-
72
-
73
-
74
-
75
-
76
-
77
-
78
-
79
-
80
-
81
-
82
-
83
-
84
-
85
-
86
-
87
-
88
-
89
-
90
-
91
-
92
-
93
-
94
-
95
-
96
-
97
-
98
-
99
-
100
-
101
-
102
-
103
-
104
-
105
-
106
-
107
-
108
-
109
-
110
-
111
-
112
 |
 |

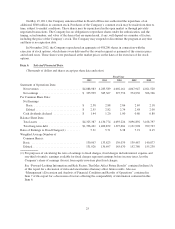
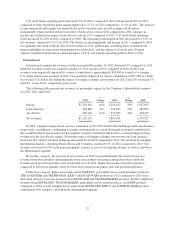
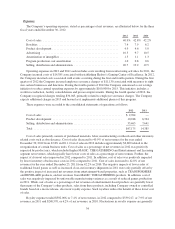
Consolidated net revenues for the year ended December 30, 2012 were $4,088,983 compared to $4,285,589
in 2011 and $4,002,161 in 2010. Most of the Company’s net revenues and operating profits were derived from its
three principal segments: the U.S. and Canada segment, the International segment and the Entertainment and
Licensing segment, which are discussed in detail below. Consolidated net revenues in 2012 and 2011 were
impacted by foreign currency translation of approximately $(98,500) and $64,300, respectively. The following
table presents net revenues by product category for the years ended December 30, 2012 and December 25, 2011.
2012
%
Change 2011
%
Change 2010
Boys ............................ $1,577,010 (13)% 1,821,544 35% 1,345,523
Games ........................... 1,192,090 2% 1,169,672 (10)% 1,293,772
Girls ............................ 792,292 7% 741,394 (11)% 830,383
Preschool ........................ 527,591 (5)% 552,979 4% 532,483
Net Revenues ..................... $4,088,983 4,285,589 4,002,161
For the year ended December 30, 2012, decreased net revenues in the boys and preschool categories were
partially offset by increases in the girls and games categories. For the year ended December 25, 2011, decreased
net revenues in the girls and games categories were more than offset by increases in the boys and preschool
categories.
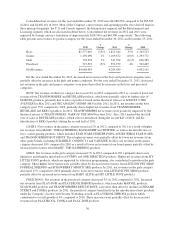
BOYS: Net revenues in the boys category decreased 13% in 2012 compared to 2011 as a result of lower net
revenues from TRANSFORMERS and BEYBLADE products, which were partially offset by higher sales of
MARVEL products, primarily due to sales of products based on the theatrical releases of MARVEL’S THE
AVENGERS in May 2012 and THE AMAZING SPIDER-MAN in July 2012. In 2011, net revenues in the boys
category grew 35% compared to 2010, primarily due to higher net revenues from TRANSFORMERS,
BEYBLADE and KRE-O products. In 2011, TRANSFORMERS net revenues were positively impacted by the
theatrical release of TRANSFORMERS: DARK OF THE MOON in June 2011. Also, 2011 marked the first full
year of sales of BEYBLADE products, which were re-introduced during the second half of 2010, and the
introduction of KRE-O products during the second half of 2011.
GAMES: Net revenues in the games category increased 2% in 2012 compared to 2011 as a result of higher
net revenues from MAGIC: THE GATHERING, BATTLESHIP and TWISTER, as well as the introduction of
boys’ action gaming products, which included STAR WARS FIGHTER PODS, ANGRY BIRDS STAR WARS
and TRANSFORMERS BOT SHOTS. These higher revenues were partially offset by lower net revenues from
other game brands, including SCRABBLE, CONNECT 4 and YAHTZEE. In 2011, net revenues in the games
category decreased 10% compared to 2010 as a result of lower net revenues from board games partially offset by
increased net revenues from MAGIC: THE GATHERING products.
GIRLS: Net revenues in the girls category increased 7% in 2012 compared to 2011 primarily due to new
initiatives including the introduction of FURBY and ONE DIRECTION products. Higher net revenues from MY
LITTLE PONY products, which are supported by television programming, also contributed to growth in the girls
category. These higher net revenues were partially offset by decreased net revenues from LITTLEST PET SHOP,
FURREAL FRIENDS and STRAWBERRY SHORTCAKE products. In 2011, net revenues in the girls category
decreased 11% compared to 2010 primarily due to lower net revenues from LITTLEST PET SHOP products
partially offset by increased net revenues from BABY ALIVE and MY LITTLE PONY products.
PRESCHOOL: Net revenues in the preschool category decreased 5% in 2012 compared to 2011. Increased
net revenues from PLAY-DOH and PLAYSKOOL HEROES products, which includes MARVEL products,
STAR WARS products and TRANSFORMERS RESCUE BOTS, were more than offset by declines in SESAME
STREET and TONKA products. In 2011, the preschool category benefited from the introduction of new products
under the Company’s license with Sesame Workshop as well as PLAYSKOOL HEROES products which
contributed to overall growth of 4% compared to 2010. These increases were partially offset by decreased net
revenues from PLAYSKOOL, TONKA and PLAY-DOH products.
30