Hasbro 2012 Annual Report Download - page 46
Download and view the complete annual report
Please find page 46 of the 2012 Hasbro annual report below. You can navigate through the pages in the report by either clicking on the pages listed below, or by using the keyword search tool below to find specific information within the annual report.-
 1
1 -
2
-
3
-
4
-
5
-
6
-
7
-
8
-
9
-
10
-
11
-
12
-
13
-
14
-
15
-
16
-
17
-
18
-
19
-
20
-
21
-
22
-
23
-
24
-
25
-
26
-
27
-
28
-
29
-
30
-
31
-
32
-
33
-
34
-
35
-
 36
36 -
 37
37 -
 38
38 -
 39
39 -
 40
40 -
 41
41 -
 42
42 -
 43
43 -
 44
44 -
 45
45 -
 46
46 -
 47
47 -
 48
48 -
 49
49 -
 50
50 -
 51
51 -
 52
52 -
 53
53 -
 54
54 -
 55
55 -
 56
56 -
57
-
58
-
59
-
60
-
61
-
62
-
63
-
64
-
65
-
66
-
67
-
68
-
69
-
70
-
71
-
72
-
73
-
74
-
75
-
76
-
77
-
78
-
79
-
80
-
81
-
82
-
83
-
84
-
85
-
86
-
87
-
88
-
89
-
90
-
91
-
92
-
93
-
94
-
95
-
96
-
97
-
98
-
99
-
100
-
101
-
102
-
103
-
104
-
105
-
106
-
107
-
108
-
109
-
110
-
111
-
112
 |
 |

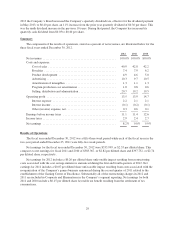
Interest Income
Interest income was $6,333 in 2012 compared to $6,834 in 2011 and $5,649 in 2010. Interest income in
2011 includes approximately $1,100 in interest received from the U.S. Internal Revenue Service related to prior
years. Absent the impact of this receipt, interest income in 2012 increased compared to 2011 reflecting higher
invested cash balances, primarily in international markets.
Other (Income) Expense, Net
Other (income) expense, net of $13,575 compares to $25,400 in 2011 and $3,676 in 2010. The decrease in
other (income) expense, net in 2012 is primarily due to lower net losses on foreign currency transactions as well
as investments gains in 2012 compared to investment losses in 2011. In 2011, the increase in other (income)
expense, net is primarily due to losses on foreign currency transactions and investment losses in 2011 compared
to gains in 2010.
Foreign currency exchange net losses of $4,178 in 2012 compared to $8,343 in 2011 and foreign currency
exchange net gains of $(725) in 2010. The net loss in 2011 includes $3,700 related to derivative instruments
which no longer qualified for hedge accounting. Investment gains of $(1,257) in 2012 compared to losses of
$4,617 in 2011 and gains of $(3,822) in 2010. The losses in 2011 primarily reflect the decrease in value of
warrants to purchase common stock of an unrelated company. Other (income) expense, net in 2012, 2011 and
2010 includes $6,015, $7,290 and $9,323 respectively, relating to the Company’s 50% share in the loss of THE
HUB.
Income Taxes
Income tax expense totaled 25.9% of pretax earnings in 2012 compared with 20.8% in 2011 and 21.7% in
2010. Income tax expense for 2012 includes net benefits of approximately $8,300 from discrete events related to
the repatriation of certain highly taxed foreign earnings and to expirations of statutes of limitations in multiple
jurisdictions. Income tax expense for 2011 is net of a benefit of approximately $29,600 from discrete tax events,
primarily related to the settlement of various tax examinations in multiple jurisdictions, including the United
States. Income tax expense for 2010 is net of a benefit of approximately $22,300 from discrete tax events,
primarily related to the settlement of various tax examinations in multiple jurisdictions, including the United
States. Absent these items and potential interest and penalties related to uncertain tax positions recorded in 2012,
2011 and 2010, the effective tax rates would have been 27.0%, 26.2% and 25.4%, respectively. The increases in
the adjusted tax rate from 2010 to 2011 and from 2011 to 2012 primarily reflect the change in the geographic mix
of where the company earned its profits.
Liquidity and Capital Resources
The Company has historically generated a significant amount of cash from operations. In 2012 the Company
funded its operations and liquidity needs primarily through cash flows from operations, and, when needed, using
borrowings under its available lines of credit and its commercial paper program. During 2013, the Company
expects to continue to fund its working capital needs primarily through cash flows from operations and, when
needed, by issuing commercial paper or borrowing under its revolving credit agreement. In the event that the
Company is not able to issue commercial paper, the Company intends to utilize its available lines of credit. The
Company believes that the funds available to it, including cash expected to be generated from operations and
funds available through its commercial paper program or its available lines of credit are adequate to meet its
working capital needs for 2013, however, unexpected events or circumstances such as material operating losses
or increased capital or other expenditures, or inability to otherwise access the commercial paper market, may
reduce or eliminate the availability of external financial resources. In addition, significant disruptions to credit
markets may also reduce or eliminate the availability of external financial resources. Although the Company
believes the risk of nonperformance by the counterparties to its financial facilities is not significant, in times of
severe economic downturn in the credit markets it is possible that one or more sources of external financing may
be unable or unwilling to provide funding to the Company.
36