Hasbro 2012 Annual Report Download - page 83
Download and view the complete annual report
Please find page 83 of the 2012 Hasbro annual report below. You can navigate through the pages in the report by either clicking on the pages listed below, or by using the keyword search tool below to find specific information within the annual report.-
 1
1 -
2
-
3
-
4
-
5
-
6
-
7
-
8
-
9
-
10
-
11
-
12
-
13
-
14
-
15
-
16
-
17
-
18
-
19
-
20
-
21
-
22
-
23
-
24
-
25
-
26
-
27
-
28
-
29
-
30
-
31
-
32
-
33
-
34
-
35
-
36
-
37
-
38
-
39
-
40
-
41
-
42
-
43
-
44
-
45
-
46
-
47
-
48
-
49
-
50
-
51
-
52
-
53
-
54
-
55
-
56
-
57
-
58
-
59
-
60
-
61
-
62
-
63
-
64
-
65
-
66
-
67
-
68
-
69
-
70
-
71
-
72
-
 73
73 -
 74
74 -
 75
75 -
 76
76 -
 77
77 -
 78
78 -
 79
79 -
 80
80 -
 81
81 -
 82
82 -
 83
83 -
 84
84 -
 85
85 -
 86
86 -
 87
87 -
 88
88 -
 89
89 -
 90
90 -
 91
91 -
 92
92 -
 93
93 -
94
-
95
-
96
-
97
-
98
-
99
-
100
-
101
-
102
-
103
-
104
-
105
-
106
-
107
-
108
-
109
-
110
-
111
-
112
 |
 |

HASBRO, INC. AND SUBSIDIARIES
Notes to Consolidated Financial Statements — (Continued)
(Thousands of Dollars and Shares Except Per Share Data)
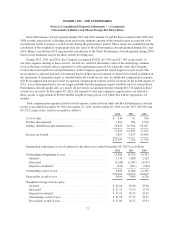
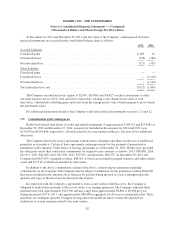
With respect to the 9,283 outstanding options and 6,094 options exercisable at December 30, 2012, the
weighted average remaining contractual life of these options was 3.57 years and 2.63 years, respectively. The
aggregate intrinsic value of the options outstanding and exercisable at December 30, 2012 was $51,521 and
$49,939, respectively.
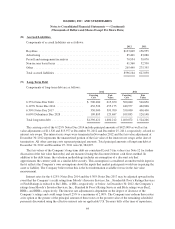
The Company uses the Black-Scholes valuation model in determining the fair value of stock options. The
weighted average fair value of options granted in fiscal 2012, 2011 and 2010 was $6.29, $9.84 and $7.24,
respectively. The fair value of each option grant is estimated on the date of grant using the Black-Scholes option
pricing model with the following weighted average assumptions used for grants in the fiscal years 2012, 2011
and 2010:
2012 2011 2010
Risk-free interest rate ....................................... 0.69% 1.64% 2.17%
Expected dividend yield ..................................... 3.99% 2.63% 2.97%
Expected volatility ......................................... 31% 30% 30%
Expected option life ........................................ 5years 5 years 5 years
The intrinsic values, which represent the difference between the fair market value on the date of exercise
and the exercise price of the option, of the options exercised in fiscal 2012, 2011 and 2010 were $49,225,
$26,308 and $80,783, respectively.
At December 30, 2012, the amount of total unrecognized compensation cost related to stock options was
$14,000 and the weighted average period over which this will be expensed is 22 months.
In 2011 and 2010, the Company granted awards to certain employees consisting of cash settled restricted
stock units. Under these awards, the recipients are granted restricted stock units that vest over three years. At the
end of the vesting period, the fair value of those units based on Hasbro’s stock price will be paid in cash to the
recipient. The Company accounts for these awards as a liability and marks the vested portion of the award to
market through the statement of operations. In 2012, 2011 and 2010, the Company recognized expense of $1,348,
$804 and $1,004, respectively related to these awards.
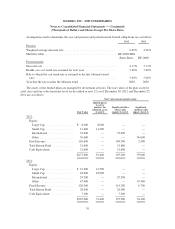
In 2012, 2011 and 2010, the Company granted 44, 33 and 36 shares of common stock, respectively, to its
non-employee members of its Board of Directors. Of these shares, the receipt of 33 shares from the 2012 grant,
27 shares from the 2011 grant and 30 shares from the 2010 grant has been deferred to the date upon which the
respective director ceases to be a member of the Company’s Board of Directors. These awards were valued at the
market value of the underlying common stock at the date of grant and vested upon grant. In connection with
these grants, compensation cost of $1,560, $1,560 and $1,440 was recorded in selling, distribution and
administration expense in 2012, 2011 and 2010, respectively.
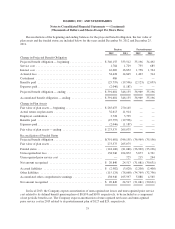
(14) Pension, Postretirement and Postemployment Benefits
Pension and Postretirement Benefits
The Company recognizes an asset or liability for each of its defined benefit pension plans equal to the
difference between the projected benefit obligation of the plan and the fair value of the plan’s assets. Actuarial
gains and losses and prior service costs that have not yet been included in income are recognized in the balance
sheet in AOCE.
Expenses related to the Company’s defined benefit pension and defined contribution plans for 2012, 2011
and 2010 were approximately $40,300, $35,500 and $34,900, respectively. Of these amounts, $29,500, $28,500
and $29,000, respectively, related to defined contribution plans in the United States and certain international
subsidiaries. The remainder of the expense relates to defined benefit pension plans discussed below.
73