Hasbro 2012 Annual Report Download - page 94
Download and view the complete annual report
Please find page 94 of the 2012 Hasbro annual report below. You can navigate through the pages in the report by either clicking on the pages listed below, or by using the keyword search tool below to find specific information within the annual report.-
 1
1 -
2
-
3
-
4
-
5
-
6
-
7
-
8
-
9
-
10
-
11
-
12
-
13
-
14
-
15
-
16
-
17
-
18
-
19
-
20
-
21
-
22
-
23
-
24
-
25
-
26
-
27
-
28
-
29
-
30
-
31
-
32
-
33
-
34
-
35
-
36
-
37
-
38
-
39
-
40
-
41
-
42
-
43
-
44
-
45
-
46
-
47
-
48
-
49
-
50
-
51
-
52
-
53
-
54
-
55
-
56
-
57
-
58
-
59
-
60
-
61
-
62
-
63
-
64
-
65
-
66
-
67
-
68
-
69
-
70
-
71
-
72
-
73
-
74
-
75
-
76
-
77
-
78
-
79
-
80
-
81
-
82
-
83
-
 84
84 -
 85
85 -
 86
86 -
 87
87 -
 88
88 -
 89
89 -
 90
90 -
 91
91 -
 92
92 -
 93
93 -
 94
94 -
 95
95 -
 96
96 -
 97
97 -
 98
98 -
 99
99 -
 100
100 -
 101
101 -
 102
102 -
 103
103 -
 104
104 -
105
-
106
-
107
-
108
-
109
-
110
-
111
-
112
 |
 |

HASBRO, INC. AND SUBSIDIARIES
Notes to Consolidated Financial Statements — (Continued)
(Thousands of Dollars and Shares Except Per Share Data)
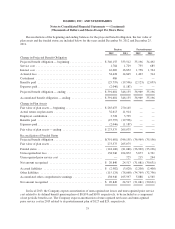
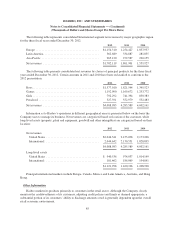
the elimination of intersegment transactions and certain assets benefiting more than one segment. Intersegment
sales and transfers are reflected in management reports at amounts approximating cost. Certain shared costs,
including global development and marketing expenses and corporate administration, are allocated to segments
based upon expenses and foreign exchange rates fixed at the beginning of the year, with adjustments to actual
expenses and foreign exchange rates included in Corporate and eliminations. The accounting policies of the
segments are the same as those referenced in note 1.
Results shown for fiscal years 2012, 2011 and 2010 are not necessarily those which would be achieved if
each segment was an unaffiliated business enterprise.
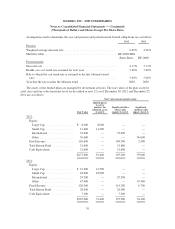
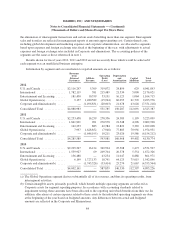
Information by segment and a reconciliation to reported amounts are as follows:
Revenues
from
External
Customers
Affiliate
Revenue
Operating
Profit
(Loss)
Depreciation
and
Amortization
Capital
Additions
Total
Assets
2012
U.S. and Canada ................ $2,116,297 5,309 319,072 24,899 629 6,041,893
International ................... 1,782,119 381 215,489 21,534 5,000 2,176,021
Entertainment and Licensing ...... 181,430 10,559 53,191 16,123 1,064 1,164,715
Global Operations(a) ............. 9,137 1,480,582 (15,964) 66,053 61,770 2,493,976
Corporate and eliminations(b) ..... — (1,496,831) (20,003) 21,678 43,628 (7,551,218)
Consolidated Total .............. $4,088,983 — 551,785 150,287 112,091 4,325,387
2011
U.S. and Canada ................ $2,253,458 16,259 278,356 24,389 1,199 5,225,099
International ................... 1,861,901 201 270,578 21,348 4,296 2,062,928
Entertainment and Licensing ...... 162,233 883 42,784 13,822 3,365 1,022,008
Global Operations(a) ............. 7,997 1,628,852 (7,948) 77,883 70,956 1,974,951
Corporate and eliminations(b) ..... — (1,646,195) 10,211 23,026 19,586 (6,154,212)
Consolidated Total .............. $4,285,589 — 593,981 160,468 99,402 4,130,774
2010
U.S. and Canada ................ $2,299,547 16,124 349,594 25,508 1,473 4,571,597
International ................... 1,559,927 69 209,704 20,378 5,554 1,672,326
Entertainment and Licensing ...... 136,488 — 43,234 11,047 8,888 861,971
Global Operations(a) ............. 6,199 1,727,133 18,741 64,123 75,015 1,542,896
Corporate and eliminations(b) ..... — (1,743,326) (33,414) 25,274 21,667 (4,555,564)
Consolidated Total .............. $4,002,161 — 587,859 146,330 112,597 4,093,226
(a) The Global Operations segment derives substantially all of its revenues, and thus its operating results, from
intersegment activities.
(b) Certain intangible assets, primarily goodwill, which benefit multiple operating segments are reflected as
Corporate assets for segment reporting purposes. In accordance with accounting standards related to
impairment testing, these amounts have been allocated to the reporting unit which benefits from their use. In
addition, allocations of certain expenses related to these assets to the individual operating segments are done
at the beginning of the year based on budgeted amounts. Any differences between actual and budgeted
amounts are reflected in the Corporate and Eliminations.
84