Hasbro 2012 Annual Report Download - page 70
Download and view the complete annual report
Please find page 70 of the 2012 Hasbro annual report below. You can navigate through the pages in the report by either clicking on the pages listed below, or by using the keyword search tool below to find specific information within the annual report.-
 1
1 -
2
-
3
-
4
-
5
-
6
-
7
-
8
-
9
-
10
-
11
-
12
-
13
-
14
-
15
-
16
-
17
-
18
-
19
-
20
-
21
-
22
-
23
-
24
-
25
-
26
-
27
-
28
-
29
-
30
-
31
-
32
-
33
-
34
-
35
-
36
-
37
-
38
-
39
-
40
-
41
-
42
-
43
-
44
-
45
-
46
-
47
-
48
-
49
-
50
-
51
-
52
-
53
-
54
-
55
-
56
-
57
-
58
-
59
-
 60
60 -
 61
61 -
 62
62 -
 63
63 -
 64
64 -
 65
65 -
 66
66 -
 67
67 -
 68
68 -
 69
69 -
 70
70 -
 71
71 -
 72
72 -
 73
73 -
 74
74 -
 75
75 -
 76
76 -
 77
77 -
 78
78 -
 79
79 -
 80
80 -
81
-
82
-
83
-
84
-
85
-
86
-
87
-
88
-
89
-
90
-
91
-
92
-
93
-
94
-
95
-
96
-
97
-
98
-
99
-
100
-
101
-
102
-
103
-
104
-
105
-
106
-
107
-
108
-
109
-
110
-
111
-
112
 |
 |

HASBRO, INC. AND SUBSIDIARIES
Notes to Consolidated Financial Statements — (Continued)
(Thousands of Dollars and Shares Except Per Share Data)
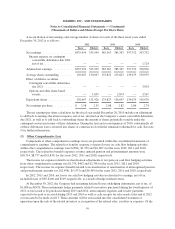
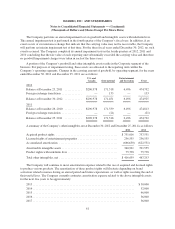
deferred losses included in AOCE at December 30, 2012, the Company expects approximately $659 to be
reclassified to the consolidated statement of operations within the next 12 months. However, the amount
ultimately realized in earnings is dependent on the fair value of the hedging instruments on the settlement dates.
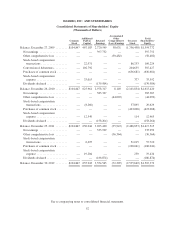
Changes in the components of accumulated other comprehensive earnings (loss) are as follows:
Pension and
Postretirement
Amounts
Gains
(Losses) on
Derivative
Instruments
Foreign
Currency
Translation
Adjustments
Total
Accumulated
Other
Comprehensive
Earnings
(Loss)
2012
Balance at Dec. 25, 2011 ............. $ (86,822) 10,081 40,798 (35,943)
Current period other comprehensive
earnings (loss) ................... (33,600) (11,089) 8,325 (36,364)
Balance at Dec. 30, 2012 ............. $(120,422) (1,008) 49,123 (72,307)
2011
Balance at Dec. 26, 2010 ............. $ (69,925) 15,432 62,642 8,149
Current period other comprehensive
earnings (loss) ................... (16,897) (5,351) (21,844) (44,092)
Balance at Dec. 25, 2011 ............. $ (86,822) 10,081 40,798 (35,943)
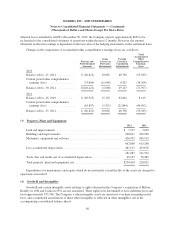
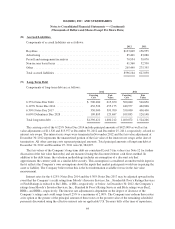
(3) Property, Plant and Equipment
2012 2011
Land and improvements ........................................... $ 7,197 7,038
Buildings and improvements ........................................ 228,611 202,258
Machinery, equipment and software .................................. 426,992 405,912
662,800 615,208
Less accumulated depreciation ...................................... 481,513 453,676
181,287 161,532
Tools, dies and molds, net of accumulated depreciation .................. 49,127 56,489
Total property, plant and equipment, net .............................. $230,414 218,021
Expenditures for maintenance and repairs which do not materially extend the life of the assets are charged to
operations as incurred.
(4) Goodwill and Intangibles
Goodwill and certain intangible assets relating to rights obtained in the Company’s acquisition of Milton
Bradley in 1984 and Tonka in 1991 are not amortized. These rights were determined to have indefinite lives and
total approximately $75,700. The Company’s other intangible assets are amortized over their remaining useful
lives, and accumulated amortization of these other intangibles is reflected in other intangibles, net in the
accompanying consolidated balance sheets.
60