Hasbro 2012 Annual Report Download - page 43
Download and view the complete annual report
Please find page 43 of the 2012 Hasbro annual report below. You can navigate through the pages in the report by either clicking on the pages listed below, or by using the keyword search tool below to find specific information within the annual report.-
 1
1 -
2
-
3
-
4
-
5
-
6
-
7
-
8
-
9
-
10
-
11
-
12
-
13
-
14
-
15
-
16
-
17
-
18
-
19
-
20
-
21
-
22
-
23
-
24
-
25
-
26
-
27
-
28
-
29
-
30
-
31
-
32
-
 33
33 -
 34
34 -
 35
35 -
 36
36 -
 37
37 -
 38
38 -
 39
39 -
 40
40 -
 41
41 -
 42
42 -
 43
43 -
 44
44 -
 45
45 -
 46
46 -
 47
47 -
 48
48 -
 49
49 -
 50
50 -
 51
51 -
 52
52 -
 53
53 -
54
-
55
-
56
-
57
-
58
-
59
-
60
-
61
-
62
-
63
-
64
-
65
-
66
-
67
-
68
-
69
-
70
-
71
-
72
-
73
-
74
-
75
-
76
-
77
-
78
-
79
-
80
-
81
-
82
-
83
-
84
-
85
-
86
-
87
-
88
-
89
-
90
-
91
-
92
-
93
-
94
-
95
-
96
-
97
-
98
-
99
-
100
-
101
-
102
-
103
-
104
-
105
-
106
-
107
-
108
-
109
-
110
-
111
-
112
 |
 |
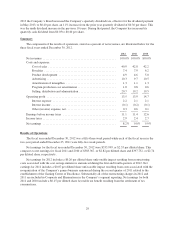
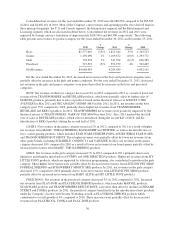
In the games category, higher net revenues from boys’ action gaming products, primarily STAR WARS and
TRANSFORMERS related, MAGIC: THE GATHERING, TWISTER and BATTLESHIP products in 2012
compared to 2011 were more than offset by decreased net revenues from other game brands. In 2011, net
revenues in the games category decreased compared to 2010 as a result of lower net revenues from board games,
partially offset by increased net revenues from MAGIC: THE GATHERING products.
Higher net revenues from MY LITTLE PONY and the introduction of FURBY products in 2012 compared
to 2011 were more than offset by lower net revenues from LITTLEST PET SHOP and FURREAL FRIENDS
products. FURBY products were introduced into English-speaking markets in 2012 and will be introduced to
certain non-English speaking markets in 2013. In 2011, the decrease in net revenues in the girls’ toys category
was primarily due to decreased net revenues from LITTLEST PET SHOP products, which were partially offset
by increased net revenues from FURREAL FRIENDS and BABY ALIVE products.
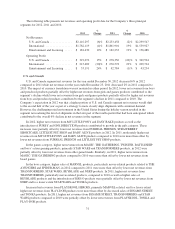
Net revenues in the preschool category were flat for 2012. Increased net revenues from PLAYSKOOL
HEROES products, primarily MARVEL-related, and PLAY-DOH products were wholly offset by decreased net
revenues from PLAYSKOOL and SESAME STREET products. In 2011, decreased net revenues from
PLAYSKOOL and TONKA products in the preschool category were partially offset by sales of SESAME
STREET products which were introduced in 2011.
International segment operating profit decreased 20% in 2012 compared to 2011 and increased 29% in 2011
compared to 2010. Operating profit margin decreased to 12.1% of net revenues in 2012 from 14.5% of net
revenues in 2011 and increased in 2011 from 13.4% of net revenues in 2010. Operating profit for the
International segment in 2012 and 2011 was impacted by approximately $(11,900) and $4,400, respectively, due
to the translation of foreign currencies to the U.S. dollar. In 2012, decreases in operating profit and operating
profit margin were primarily due to lower net revenues discussed above in addition to higher selling, distribution
and administration expenses. Higher cost of sales as a percentage of net revenues was partially offset by lower
royalty expense as a result of the mix of entertainment-based and non-entertainment based product sales. Further,
the decline in operating profit margin in 2012 compared to 2011 reflects the change in geographical mix of net
revenues, with a higher percentage coming from emerging markets, which currently have lower operating profit
margins than the Company has in developed markets. In 2011, the increase in operating profit was primarily
driven by the increased net revenues described above. This was partially offset by higher royalty expense as a
result of increased revenues from higher royalty-bearing products, particularly BEYBLADE and movie-related
TRANSFORMERS products. The increase in operating profit margin was largely due to the impact of the
increased net revenues.
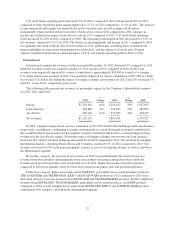
Entertainment and Licensing
Entertainment and Licensing segment net revenues increased 12% in 2012 compared to 2011 and 19% in
2011 compared to 2010. Increases for each year were primarily due to the sale and distribution of television
programming which included global television distribution, digital distribution and home entertainment.
Increased net revenues in 2012 compared to 2011 were partially offset by decreased net revenues from lifestyle
licensing primarily relating to lower TRANSFORMERS movie-related licensing revenues whereas lifestyle
licensing revenues increased in 2011 compared to 2010, related to TRANSFORMERS movie-related licensing
revenues.
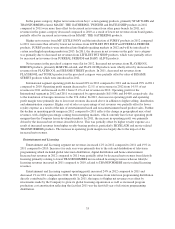
Entertainment and Licensing segment operating profit increased 24% in 2012 compared to 2011 and
decreased 1% in 2011 compared to 2010. In 2012, higher net revenues from television programming distribution
directly contributed to a higher operating profit. In 2011, the impact of higher net revenues was offset by
investments made by the Company to grow its global licensing organization as well as increased program
production cost amortization reflecting the fact that 2011 was the first full year of television programming
distribution.
33