HSBC 2015 Annual Report Download - page 387
Download and view the complete annual report
Please find page 387 of the 2015 HSBC annual report below. You can navigate through the pages in the report by either clicking on the pages listed below, or by using the keyword search tool below to find specific information within the annual report.-
 1
1 -
2
-
3
-
4
-
5
-
6
-
7
-
8
-
9
-
10
-
11
-
12
-
13
-
14
-
15
-
16
-
17
-
18
-
19
-
20
-
21
-
22
-
23
-
24
-
25
-
26
-
27
-
28
-
29
-
30
-
31
-
32
-
33
-
34
-
35
-
36
-
37
-
38
-
39
-
40
-
41
-
42
-
43
-
44
-
45
-
46
-
47
-
48
-
49
-
50
-
51
-
52
-
53
-
54
-
55
-
56
-
57
-
58
-
59
-
60
-
61
-
62
-
63
-
64
-
65
-
66
-
67
-
68
-
69
-
70
-
71
-
72
-
73
-
74
-
75
-
76
-
77
-
78
-
79
-
80
-
81
-
82
-
83
-
84
-
85
-
86
-
87
-
88
-
89
-
90
-
91
-
92
-
93
-
94
-
95
-
96
-
97
-
98
-
99
-
100
-
101
-
102
-
103
-
104
-
105
-
106
-
107
-
108
-
109
-
110
-
111
-
112
-
113
-
114
-
115
-
116
-
117
-
118
-
119
-
120
-
121
-
122
-
123
-
124
-
125
-
126
-
127
-
128
-
129
-
130
-
131
-
132
-
133
-
134
-
135
-
136
-
137
-
138
-
139
-
140
-
141
-
142
-
143
-
144
-
145
-
146
-
147
-
148
-
149
-
150
-
151
-
152
-
153
-
154
-
155
-
156
-
157
-
158
-
159
-
160
-
161
-
162
-
163
-
164
-
165
-
166
-
167
-
168
-
169
-
170
-
171
-
172
-
173
-
174
-
175
-
176
-
177
-
178
-
179
-
180
-
181
-
182
-
183
-
184
-
185
-
186
-
187
-
188
-
189
-
190
-
191
-
192
-
193
-
194
-
195
-
196
-
197
-
198
-
199
-
200
-
201
-
202
-
203
-
204
-
205
-
206
-
207
-
208
-
209
-
210
-
211
-
212
-
213
-
214
-
215
-
216
-
217
-
218
-
219
-
220
-
221
-
222
-
223
-
224
-
225
-
226
-
227
-
228
-
229
-
230
-
231
-
232
-
233
-
234
-
235
-
236
-
237
-
238
-
239
-
240
-
241
-
242
-
243
-
244
-
245
-
246
-
247
-
248
-
249
-
250
-
251
-
252
-
253
-
254
-
255
-
256
-
257
-
258
-
259
-
260
-
261
-
262
-
263
-
264
-
265
-
266
-
267
-
268
-
269
-
270
-
271
-
272
-
273
-
274
-
275
-
276
-
277
-
278
-
279
-
280
-
281
-
282
-
283
-
284
-
285
-
286
-
287
-
288
-
289
-
290
-
291
-
292
-
293
-
294
-
295
-
296
-
297
-
298
-
299
-
300
-
301
-
302
-
303
-
304
-
305
-
306
-
307
-
308
-
309
-
310
-
311
-
312
-
313
-
314
-
315
-
316
-
317
-
318
-
319
-
320
-
321
-
322
-
323
-
324
-
325
-
326
-
327
-
328
-
329
-
330
-
331
-
332
-
333
-
334
-
335
-
336
-
337
-
338
-
339
-
340
-
341
-
342
-
343
-
344
-
345
-
346
-
347
-
348
-
349
-
350
-
351
-
352
-
353
-
354
-
355
-
356
-
357
-
358
-
359
-
360
-
361
-
362
-
363
-
364
-
365
-
366
-
367
-
368
-
369
-
370
-
371
-
372
-
373
-
374
-
375
-
376
-
 377
377 -
 378
378 -
 379
379 -
 380
380 -
 381
381 -
 382
382 -
 383
383 -
 384
384 -
 385
385 -
 386
386 -
 387
387 -
 388
388 -
 389
389 -
 390
390 -
 391
391 -
 392
392 -
 393
393 -
 394
394 -
 395
395 -
 396
396 -
 397
397 -
398
-
399
-
400
-
401
-
402
-
403
-
404
-
405
-
406
-
407
-
408
-
409
-
410
-
411
-
412
-
413
-
414
-
415
-
416
-
417
-
418
-
419
-
420
-
421
-
422
-
423
-
424
-
425
-
426
-
427
-
428
-
429
-
430
-
431
-
432
-
433
-
434
-
435
-
436
-
437
-
438
-
439
-
440
-
441
-
442
-
443
-
444
-
445
-
446
-
447
-
448
-
449
-
450
-
451
-
452
-
453
-
454
-
455
-
456
-
457
-
458
-
459
-
460
-
461
-
462
-
463
-
464
-
465
-
466
-
467
-
468
-
469
-
470
-
471
-
472
-
473
-
474
-
475
-
476
-
477
-
478
-
479
-
480
-
481
-
482
-
483
-
484
-
485
-
486
-
487
-
488
-
489
-
490
-
491
-
492
-
493
-
494
-
495
-
496
-
497
-
498
-
499
-
500
-
501
-
502
 |
 |
HSBC HOLDINGS PLC
385
Strategic Report Financial Review Corporate Governance Financial Statements Shareholder Information
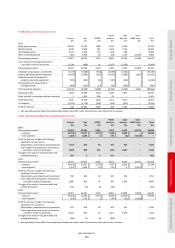
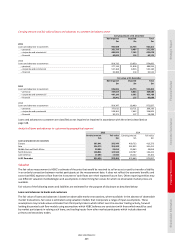
Assets Liabilities
Available
for sale
Held for
trading
Designated
at fair value
through
profit or loss Derivatives
Held for
trading
Designated
at fair value
through
profit or loss Derivatives
$m $m $m $m $m $m $m
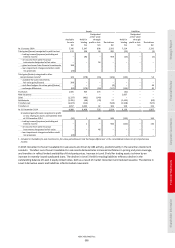
At 1 January 2014 7,245 5,347 608 2,502 7,514
–
2,335
Total gains/(losses) recognised in profit or loss 174 194 56 959 (25)
–
(5)
–
trading income/(expense) excluding net
interest income – 194 – 959 (25) – (5)
–
net income from other financial
instruments designated at fair value – – 56 – – – –
–
gains less losses from financial investments 198
–
loan impairment charges and other credit
risk provisions (24)
Total gains/(losses) recognised in other
comprehensive income1 126 (178) (16) (126) (123) – 54
–
available-for-sale investments:
fair value gains/(losses) 208 – – – – – –
–
cash flow hedges: fair value gains/(losses)
–
–
–
(9)
–
–
34
–
exchange differences (82) (178) (16) (117) (123)
–
20
Purchases 1,505 705 273
–
(31)
–
–
New issuances
–
–
–
–
2,067
–
–
Sales (1,237) (481) (149)
–
–
–
–
Settlements (1,255) (49) (78) 27 (1,655)
–
(69)
Transfers out (3,027) (112)
–
(544) (1,918)
–
(527)
Transfers in 1,457 1,042 32 106 310
–
119
At 31 December 2014 4,988 6,468 726 2,924 6,139
–
1,907
Unrealised gains/(losses) recognised in profit
or loss relating to assets and liabilities held
at 31 December 2014 (24) 1 46 946 (122) – 134
–
trading income/(expense) excluding net
interest income – 1 – 946 (122) – 134
–
net income from other financial
instruments designated at fair value – – 46 – – – –
–
loan impairment charges and other credit
risk provisions (24) – – – – – –
1 Included in ‘Available-for-sale investments: fair value gains/(losses)’ and ‘Exchange differences’ in the consolidated statement of comprehensive
income.
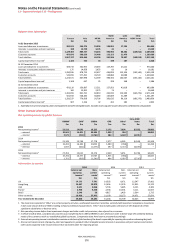
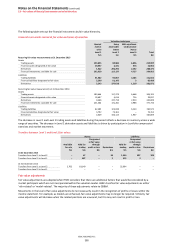
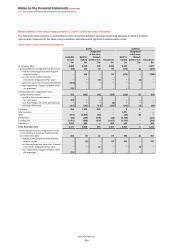
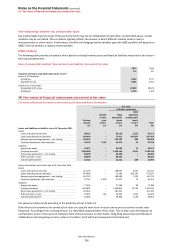
In 2015 movement of Level 3 available-for-sale assets are driven by ABS activity, predominantly in the securities investment
conduits. Transfers out of Level 3 available-for-sale assets demonstrates increased confidence in pricing and price coverage,
and transfers in reflect limited availability of third-party prices. Increase in Level 3 held for trading assets is driven by an
increase in recently-issued syndicated loans. The decline in Level 3 held for trading liabilities reflects a decline in the
outstanding balance of Level 3 equity-linked notes, both as a result of market movement and reduced issuance. The decline in
Level 3 derivative assets and liabilities reflects market movement.