HSBC 2015 Annual Report Download - page 315
Download and view the complete annual report
Please find page 315 of the 2015 HSBC annual report below. You can navigate through the pages in the report by either clicking on the pages listed below, or by using the keyword search tool below to find specific information within the annual report.-
 1
1 -
2
-
3
-
4
-
5
-
6
-
7
-
8
-
9
-
10
-
11
-
12
-
13
-
14
-
15
-
16
-
17
-
18
-
19
-
20
-
21
-
22
-
23
-
24
-
25
-
26
-
27
-
28
-
29
-
30
-
31
-
32
-
33
-
34
-
35
-
36
-
37
-
38
-
39
-
40
-
41
-
42
-
43
-
44
-
45
-
46
-
47
-
48
-
49
-
50
-
51
-
52
-
53
-
54
-
55
-
56
-
57
-
58
-
59
-
60
-
61
-
62
-
63
-
64
-
65
-
66
-
67
-
68
-
69
-
70
-
71
-
72
-
73
-
74
-
75
-
76
-
77
-
78
-
79
-
80
-
81
-
82
-
83
-
84
-
85
-
86
-
87
-
88
-
89
-
90
-
91
-
92
-
93
-
94
-
95
-
96
-
97
-
98
-
99
-
100
-
101
-
102
-
103
-
104
-
105
-
106
-
107
-
108
-
109
-
110
-
111
-
112
-
113
-
114
-
115
-
116
-
117
-
118
-
119
-
120
-
121
-
122
-
123
-
124
-
125
-
126
-
127
-
128
-
129
-
130
-
131
-
132
-
133
-
134
-
135
-
136
-
137
-
138
-
139
-
140
-
141
-
142
-
143
-
144
-
145
-
146
-
147
-
148
-
149
-
150
-
151
-
152
-
153
-
154
-
155
-
156
-
157
-
158
-
159
-
160
-
161
-
162
-
163
-
164
-
165
-
166
-
167
-
168
-
169
-
170
-
171
-
172
-
173
-
174
-
175
-
176
-
177
-
178
-
179
-
180
-
181
-
182
-
183
-
184
-
185
-
186
-
187
-
188
-
189
-
190
-
191
-
192
-
193
-
194
-
195
-
196
-
197
-
198
-
199
-
200
-
201
-
202
-
203
-
204
-
205
-
206
-
207
-
208
-
209
-
210
-
211
-
212
-
213
-
214
-
215
-
216
-
217
-
218
-
219
-
220
-
221
-
222
-
223
-
224
-
225
-
226
-
227
-
228
-
229
-
230
-
231
-
232
-
233
-
234
-
235
-
236
-
237
-
238
-
239
-
240
-
241
-
242
-
243
-
244
-
245
-
246
-
247
-
248
-
249
-
250
-
251
-
252
-
253
-
254
-
255
-
256
-
257
-
258
-
259
-
260
-
261
-
262
-
263
-
264
-
265
-
266
-
267
-
268
-
269
-
270
-
271
-
272
-
273
-
274
-
275
-
276
-
277
-
278
-
279
-
280
-
281
-
282
-
283
-
284
-
285
-
286
-
287
-
288
-
289
-
290
-
291
-
292
-
293
-
294
-
295
-
296
-
297
-
298
-
299
-
300
-
301
-
302
-
303
-
304
-
 305
305 -
 306
306 -
 307
307 -
 308
308 -
 309
309 -
 310
310 -
 311
311 -
 312
312 -
 313
313 -
 314
314 -
 315
315 -
 316
316 -
 317
317 -
 318
318 -
 319
319 -
 320
320 -
 321
321 -
 322
322 -
 323
323 -
 324
324 -
 325
325 -
326
-
327
-
328
-
329
-
330
-
331
-
332
-
333
-
334
-
335
-
336
-
337
-
338
-
339
-
340
-
341
-
342
-
343
-
344
-
345
-
346
-
347
-
348
-
349
-
350
-
351
-
352
-
353
-
354
-
355
-
356
-
357
-
358
-
359
-
360
-
361
-
362
-
363
-
364
-
365
-
366
-
367
-
368
-
369
-
370
-
371
-
372
-
373
-
374
-
375
-
376
-
377
-
378
-
379
-
380
-
381
-
382
-
383
-
384
-
385
-
386
-
387
-
388
-
389
-
390
-
391
-
392
-
393
-
394
-
395
-
396
-
397
-
398
-
399
-
400
-
401
-
402
-
403
-
404
-
405
-
406
-
407
-
408
-
409
-
410
-
411
-
412
-
413
-
414
-
415
-
416
-
417
-
418
-
419
-
420
-
421
-
422
-
423
-
424
-
425
-
426
-
427
-
428
-
429
-
430
-
431
-
432
-
433
-
434
-
435
-
436
-
437
-
438
-
439
-
440
-
441
-
442
-
443
-
444
-
445
-
446
-
447
-
448
-
449
-
450
-
451
-
452
-
453
-
454
-
455
-
456
-
457
-
458
-
459
-
460
-
461
-
462
-
463
-
464
-
465
-
466
-
467
-
468
-
469
-
470
-
471
-
472
-
473
-
474
-
475
-
476
-
477
-
478
-
479
-
480
-
481
-
482
-
483
-
484
-
485
-
486
-
487
-
488
-
489
-
490
-
491
-
492
-
493
-
494
-
495
-
496
-
497
-
498
-
499
-
500
-
501
-
502
 |
 |

HSBC HOLDINGS PLC
313
Strategic Report Financial Review Corporate Governance Financial Statements Shareholder Information
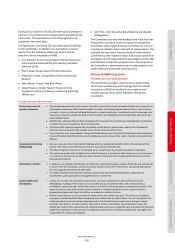
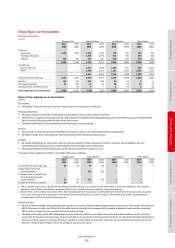
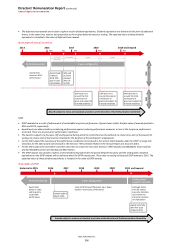
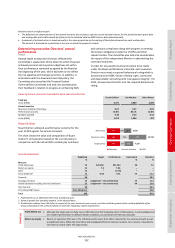
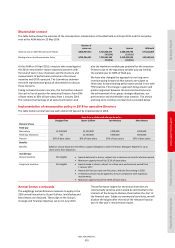
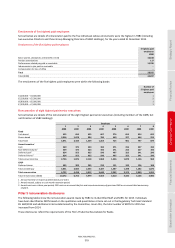
CEO remuneration
Historical CEO remuneration
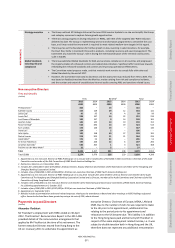
The table below summarises the CEO’s single figure remuneration over the past seven years together with the outcomes of the
respective annual incentive and long-term incentive awards.
Single
figure of
remuneration
Annual
incentive
maximum2
Annual
incentive
paid2
Long-term
incentive
maximum4
Long-term
incentive
paid4
(£000) (% of fixed pay)3(% of maximum) (% of fixed pay)3 (% of maximum)
2015 Stuart Gulliver 7,340 67 45.0 133 41.3
2014 Stuart Gulliver 7,619 67 54.1 133 44.3
2013 Stuart Gulliver 8,033 300 49.0 600 49.0
2012 Stuart Gulliver 7,532 300 52.0 600 40.0
2011 Stuart Gulliver 8,047 300 57.5 600 50.0
20101 Michael Geoghegan 7,932 400 81.6 700 19.1
20091 Michael Geoghegan 7,580 400 93.5 700 25.4
1 The GPSP was introduced in 2011. Prior to this, values shown relate to awards of Performance Shares under the HSBC Share Plan. Under this plan
Performance Share awards vest three years after grant subject to performance conditions of total shareholder return, economic profit and earnings
per share, and an over-riding ‘sustained improvement’ judgement by the committee.
2 The 2012 annual incentive figure for Stuart Gulliver used for this table includes 60% of the annual incentive disclosed in the 2012 Directors’
Remuneration Report which was deferred for five years. The vesting of these awards is subject to service condition and satisfactory completion of the
US DPA. The US DPA condition ends on or around the fifth anniversary of the award date unless the DPA is extended or otherwise continues beyond
that date, in which case the awards will vest on or around the date on which it expires and otherwise ceases to operate.
3 For 2014 and 2015, fixed pay includes base salary, fixed pay allowance and pension allowance for the year, and excludes benefits. For 2013 and
earlier, fixed pay includes base salary only.
4 Long-term incentive awards are shown in the year where the performance period is deemed to be substantially completed. For performance share
awards this is at the end of the third financial year following the date of grant (Performance Share awards shown in 2010 therefore relate to awards
granted in 2008). For GPSP awards this is at the end of the financial year preceding the date of grant (GPSP awards shown in 2011 to 2015 therefore
relate to awards granted in 2012 to 2016).
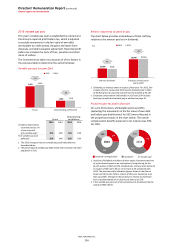
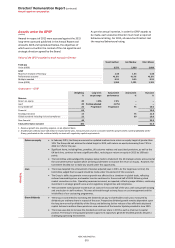
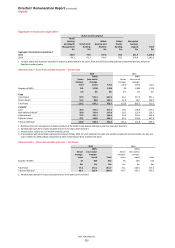
Comparison of Group CEO and all-employee pay
The following table compares the changes in Group CEO pay to changes in employee pay between 2014 and 2015:
Percentage change in remuneration
Base
salary Benefits
Annual
incentive5
Group CEO
–
112%3 (17)%
Employee group 8%2(5)%4 (5)%
1 Group CEO’s total fixed pay has not increased since 1 January 2014.
2 The comparator group has been changed to local full-time UK employees as representative of employees from the different business and functions
across the Group. During 2015, certain allowances and other benefits were rolled up into base salaries, resulting in an overall increase in the average
base salary per employee.
3 There has been no change in the benefits provided to the Group CEO or any new benefit provided to the Group CEO during 2015. The benefit value of
the bank-owned property in Hong Kong is based on the current market rental value as estimated by an external lease service provider. As the market
value of the accommodation has increased in 2015 this has resulted in a higher reportable value of this benefit in the single figure table.
4 Employee group consists of UK employees eligible for taxable benefits only as it was deemed the most appropriate comparison for the Group CEO
given varying local requirements. There has been no change in the benefit coverage from 2014 to 2015 and the reduction in the average cost of
benefit per employee is reflective of the decrease in the cost of providing such benefit on average. During 2015, approximately 20,000 more
employees became eligible for these benefits and the overall cost per employee reduced.
5 Employee group consists of all employees globally, based on annual incentive pool less GPSP as disclosed in financial reports and staff numbers
(full-time equivalents at the financial year-end).