HSBC 2015 Annual Report Download - page 189
Download and view the complete annual report
Please find page 189 of the 2015 HSBC annual report below. You can navigate through the pages in the report by either clicking on the pages listed below, or by using the keyword search tool below to find specific information within the annual report.-
 1
1 -
2
-
3
-
4
-
5
-
6
-
7
-
8
-
9
-
10
-
11
-
12
-
13
-
14
-
15
-
16
-
17
-
18
-
19
-
20
-
21
-
22
-
23
-
24
-
25
-
26
-
27
-
28
-
29
-
30
-
31
-
32
-
33
-
34
-
35
-
36
-
37
-
38
-
39
-
40
-
41
-
42
-
43
-
44
-
45
-
46
-
47
-
48
-
49
-
50
-
51
-
52
-
53
-
54
-
55
-
56
-
57
-
58
-
59
-
60
-
61
-
62
-
63
-
64
-
65
-
66
-
67
-
68
-
69
-
70
-
71
-
72
-
73
-
74
-
75
-
76
-
77
-
78
-
79
-
80
-
81
-
82
-
83
-
84
-
85
-
86
-
87
-
88
-
89
-
90
-
91
-
92
-
93
-
94
-
95
-
96
-
97
-
98
-
99
-
100
-
101
-
102
-
103
-
104
-
105
-
106
-
107
-
108
-
109
-
110
-
111
-
112
-
113
-
114
-
115
-
116
-
117
-
118
-
119
-
120
-
121
-
122
-
123
-
124
-
125
-
126
-
127
-
128
-
129
-
130
-
131
-
132
-
133
-
134
-
135
-
136
-
137
-
138
-
139
-
140
-
141
-
142
-
143
-
144
-
145
-
146
-
147
-
148
-
149
-
150
-
151
-
152
-
153
-
154
-
155
-
156
-
157
-
158
-
159
-
160
-
161
-
162
-
163
-
164
-
165
-
166
-
167
-
168
-
169
-
170
-
171
-
172
-
173
-
174
-
175
-
176
-
177
-
178
-
 179
179 -
 180
180 -
 181
181 -
 182
182 -
 183
183 -
 184
184 -
 185
185 -
 186
186 -
 187
187 -
 188
188 -
 189
189 -
 190
190 -
 191
191 -
 192
192 -
 193
193 -
 194
194 -
 195
195 -
 196
196 -
 197
197 -
 198
198 -
 199
199 -
200
-
201
-
202
-
203
-
204
-
205
-
206
-
207
-
208
-
209
-
210
-
211
-
212
-
213
-
214
-
215
-
216
-
217
-
218
-
219
-
220
-
221
-
222
-
223
-
224
-
225
-
226
-
227
-
228
-
229
-
230
-
231
-
232
-
233
-
234
-
235
-
236
-
237
-
238
-
239
-
240
-
241
-
242
-
243
-
244
-
245
-
246
-
247
-
248
-
249
-
250
-
251
-
252
-
253
-
254
-
255
-
256
-
257
-
258
-
259
-
260
-
261
-
262
-
263
-
264
-
265
-
266
-
267
-
268
-
269
-
270
-
271
-
272
-
273
-
274
-
275
-
276
-
277
-
278
-
279
-
280
-
281
-
282
-
283
-
284
-
285
-
286
-
287
-
288
-
289
-
290
-
291
-
292
-
293
-
294
-
295
-
296
-
297
-
298
-
299
-
300
-
301
-
302
-
303
-
304
-
305
-
306
-
307
-
308
-
309
-
310
-
311
-
312
-
313
-
314
-
315
-
316
-
317
-
318
-
319
-
320
-
321
-
322
-
323
-
324
-
325
-
326
-
327
-
328
-
329
-
330
-
331
-
332
-
333
-
334
-
335
-
336
-
337
-
338
-
339
-
340
-
341
-
342
-
343
-
344
-
345
-
346
-
347
-
348
-
349
-
350
-
351
-
352
-
353
-
354
-
355
-
356
-
357
-
358
-
359
-
360
-
361
-
362
-
363
-
364
-
365
-
366
-
367
-
368
-
369
-
370
-
371
-
372
-
373
-
374
-
375
-
376
-
377
-
378
-
379
-
380
-
381
-
382
-
383
-
384
-
385
-
386
-
387
-
388
-
389
-
390
-
391
-
392
-
393
-
394
-
395
-
396
-
397
-
398
-
399
-
400
-
401
-
402
-
403
-
404
-
405
-
406
-
407
-
408
-
409
-
410
-
411
-
412
-
413
-
414
-
415
-
416
-
417
-
418
-
419
-
420
-
421
-
422
-
423
-
424
-
425
-
426
-
427
-
428
-
429
-
430
-
431
-
432
-
433
-
434
-
435
-
436
-
437
-
438
-
439
-
440
-
441
-
442
-
443
-
444
-
445
-
446
-
447
-
448
-
449
-
450
-
451
-
452
-
453
-
454
-
455
-
456
-
457
-
458
-
459
-
460
-
461
-
462
-
463
-
464
-
465
-
466
-
467
-
468
-
469
-
470
-
471
-
472
-
473
-
474
-
475
-
476
-
477
-
478
-
479
-
480
-
481
-
482
-
483
-
484
-
485
-
486
-
487
-
488
-
489
-
490
-
491
-
492
-
493
-
494
-
495
-
496
-
497
-
498
-
499
-
500
-
501
-
502
 |
 |
HSBC HOLDINGS PLC
187
Strategic Report Financial Review Corporate Governance Financial Statements Shareholder Information
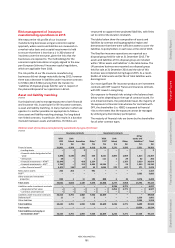
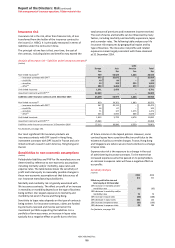
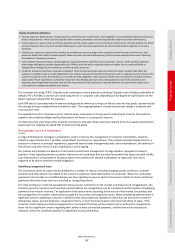
Reinsurers’ share of liabilities under insurance contracts42
(Audited)
Neither past due nor impaired Past due but
Strong Good Satisfactory Sub-standard not impaired Total
$m $m $m $m $m $m
Unit-linked insurance 84 179
–
–
–
263
Non-linked insurance50 1,102 4 9
–
–
1,115
At 31 December 2015 1,186 183 9
–
–
1,378
Reinsurance debtors 19 3
–
–
17 39
Unit-linked insurance 75 185
–
–
–
260
Non-linked insurance50 751 11 10
–
–
772
At 31 December 2014 826 196 10
–
–
1,032
Reinsurance debtors 11 6
–
–
21 38
For footnotes, see page 191.
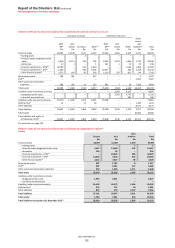
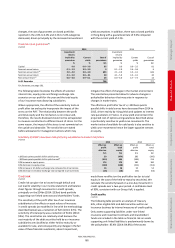
Liquidity risk
(Audited)
The following tables show the expected undiscounted cash
flows for insurance contract liabilities and the remaining
contractual maturity of investment contract liabilities at
31 December 2015. The liquidity risk exposure is borne in
conjunction with policyholders for the majority of our
business, and wholly borne by the policyholder in the case
of unit-linked business.
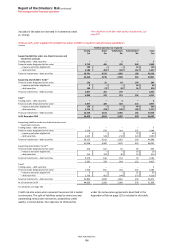
The classification of Brazilian insurance operations as held
for sale has reduced the undiscounted expected cash flows
relating to insurance liabilities by $(5.1)bn. However, the
profile of the expected maturity of the insurance contracts
at 31 December 2015 remained comparable with 2014.
Expected maturity of insurance contract liabilities42
(Audited)
Expected cash flows (undiscounted)
Within 1 year 1-5 years 5-15 years Over 15 years Total
$m $m $m $m $m
Unit-linked insurance 549 2,164 5,945 11,080 19,738
Non-linked insurance50 3,715 15,131 30,596 32,336 81,778
At 31 December 2015 4,264 17,295 36,541 43,416 101,516
Unit-linked insurance 709 3,280 9,243 14,544 27,776
Non-linked insurance50 3,504 12,718 29,905 33,108 79,235
At 31 December 2014 4,213 15,998 39,148 47,652 107,011
For footnotes, see page 191.
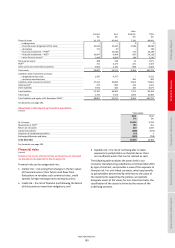
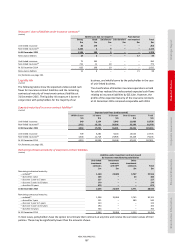
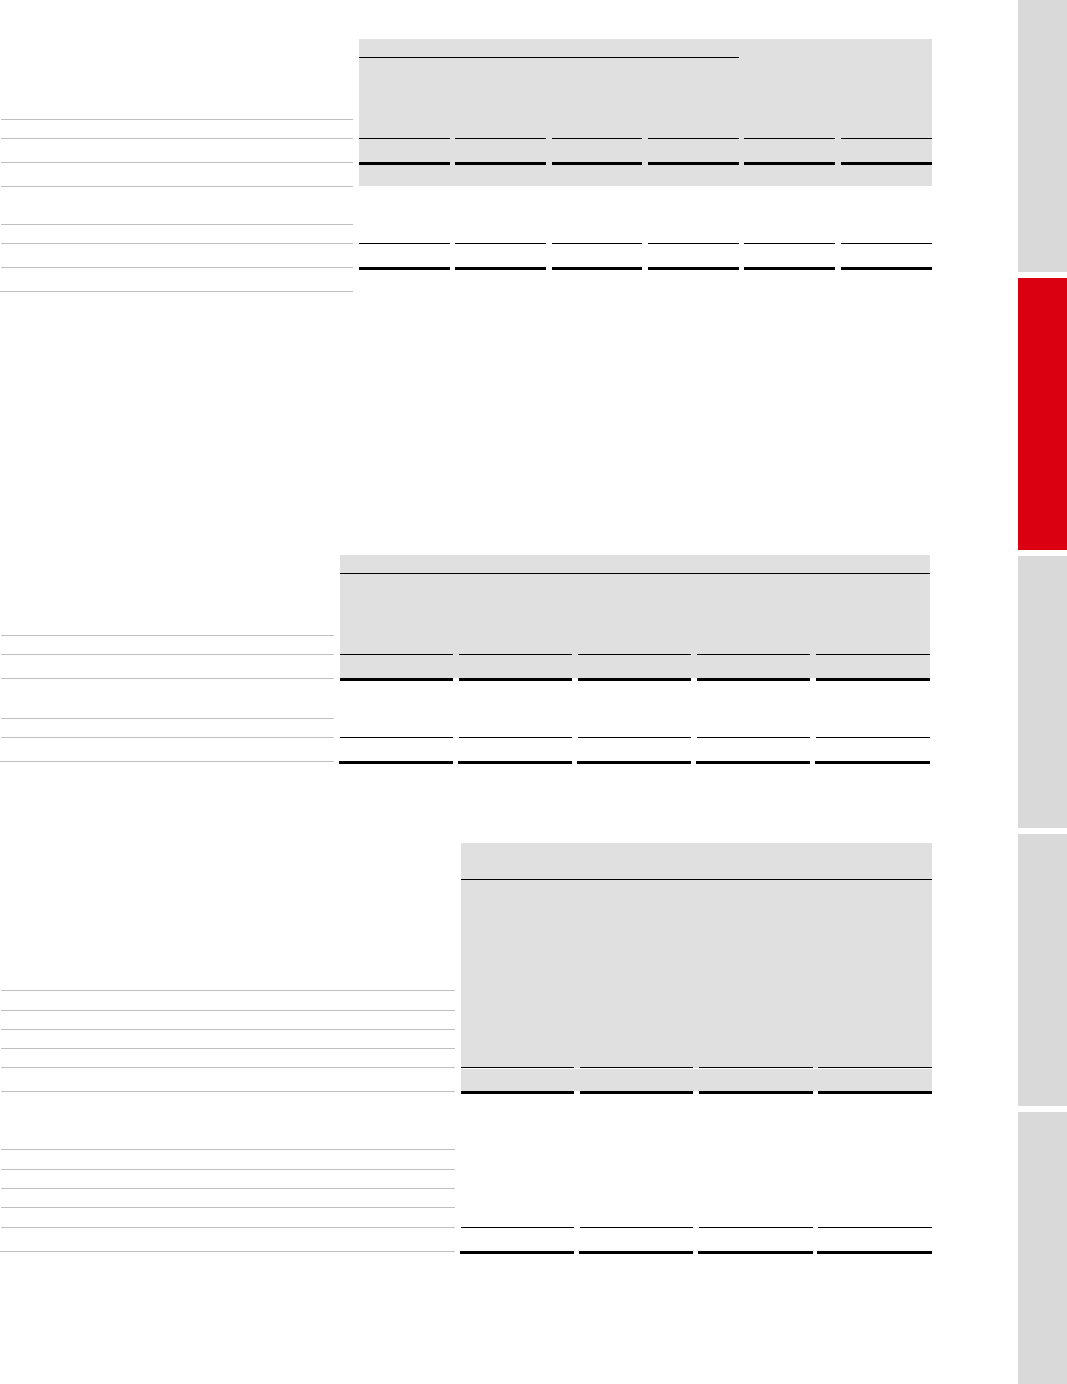
Remaining contractual maturity of investment contract liabilities
(Audited)
Liabilities under investment contracts issued
by insurance manufacturing subsidiaries
Unit-linked
investment
contracts
Investment
contracts
with DPF
Other
investment
contracts
Total
$m $m $m $m
Remaining contractual maturity:
–
undated51 1,160 22,609 3,747 27,516
–
due within 1 year 136
–
24 160
–
due over 1 year to 5 years 117
–
–
117
–
due over 5 years to 10 years 170
–
–
170
–
due after 10 years 673
–
–
673
At 31 December 2015 2,256 22,609 3,771 28,636
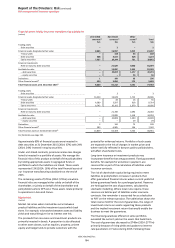
Remaining contractual maturity:
–
undated51 1,298 25,068 3,765 30,131
–
due within 1 year 151
–
389 540
–
due over 1 year to 5 years 133
–
–
133
–
due over 5 years to 10 years 194
–
–
194
–
due after 10 years 766
–
–
766
At 31 December 2014 2,542 25,068 4,154 31,764
In most cases, policyholders have the option to terminate their contracts at any time and receive the surrender values of their
policies. These may be significantly lower than the amounts shown.