HSBC 2015 Annual Report Download - page 129
Download and view the complete annual report
Please find page 129 of the 2015 HSBC annual report below. You can navigate through the pages in the report by either clicking on the pages listed below, or by using the keyword search tool below to find specific information within the annual report.-
 1
1 -
2
-
3
-
4
-
5
-
6
-
7
-
8
-
9
-
10
-
11
-
12
-
13
-
14
-
15
-
16
-
17
-
18
-
19
-
20
-
21
-
22
-
23
-
24
-
25
-
26
-
27
-
28
-
29
-
30
-
31
-
32
-
33
-
34
-
35
-
36
-
37
-
38
-
39
-
40
-
41
-
42
-
43
-
44
-
45
-
46
-
47
-
48
-
49
-
50
-
51
-
52
-
53
-
54
-
55
-
56
-
57
-
58
-
59
-
60
-
61
-
62
-
63
-
64
-
65
-
66
-
67
-
68
-
69
-
70
-
71
-
72
-
73
-
74
-
75
-
76
-
77
-
78
-
79
-
80
-
81
-
82
-
83
-
84
-
85
-
86
-
87
-
88
-
89
-
90
-
91
-
92
-
93
-
94
-
95
-
96
-
97
-
98
-
99
-
100
-
101
-
102
-
103
-
104
-
105
-
106
-
107
-
108
-
109
-
110
-
111
-
112
-
113
-
114
-
115
-
116
-
117
-
118
-
 119
119 -
 120
120 -
 121
121 -
 122
122 -
 123
123 -
 124
124 -
 125
125 -
 126
126 -
 127
127 -
 128
128 -
 129
129 -
 130
130 -
 131
131 -
 132
132 -
 133
133 -
 134
134 -
 135
135 -
 136
136 -
 137
137 -
 138
138 -
 139
139 -
140
-
141
-
142
-
143
-
144
-
145
-
146
-
147
-
148
-
149
-
150
-
151
-
152
-
153
-
154
-
155
-
156
-
157
-
158
-
159
-
160
-
161
-
162
-
163
-
164
-
165
-
166
-
167
-
168
-
169
-
170
-
171
-
172
-
173
-
174
-
175
-
176
-
177
-
178
-
179
-
180
-
181
-
182
-
183
-
184
-
185
-
186
-
187
-
188
-
189
-
190
-
191
-
192
-
193
-
194
-
195
-
196
-
197
-
198
-
199
-
200
-
201
-
202
-
203
-
204
-
205
-
206
-
207
-
208
-
209
-
210
-
211
-
212
-
213
-
214
-
215
-
216
-
217
-
218
-
219
-
220
-
221
-
222
-
223
-
224
-
225
-
226
-
227
-
228
-
229
-
230
-
231
-
232
-
233
-
234
-
235
-
236
-
237
-
238
-
239
-
240
-
241
-
242
-
243
-
244
-
245
-
246
-
247
-
248
-
249
-
250
-
251
-
252
-
253
-
254
-
255
-
256
-
257
-
258
-
259
-
260
-
261
-
262
-
263
-
264
-
265
-
266
-
267
-
268
-
269
-
270
-
271
-
272
-
273
-
274
-
275
-
276
-
277
-
278
-
279
-
280
-
281
-
282
-
283
-
284
-
285
-
286
-
287
-
288
-
289
-
290
-
291
-
292
-
293
-
294
-
295
-
296
-
297
-
298
-
299
-
300
-
301
-
302
-
303
-
304
-
305
-
306
-
307
-
308
-
309
-
310
-
311
-
312
-
313
-
314
-
315
-
316
-
317
-
318
-
319
-
320
-
321
-
322
-
323
-
324
-
325
-
326
-
327
-
328
-
329
-
330
-
331
-
332
-
333
-
334
-
335
-
336
-
337
-
338
-
339
-
340
-
341
-
342
-
343
-
344
-
345
-
346
-
347
-
348
-
349
-
350
-
351
-
352
-
353
-
354
-
355
-
356
-
357
-
358
-
359
-
360
-
361
-
362
-
363
-
364
-
365
-
366
-
367
-
368
-
369
-
370
-
371
-
372
-
373
-
374
-
375
-
376
-
377
-
378
-
379
-
380
-
381
-
382
-
383
-
384
-
385
-
386
-
387
-
388
-
389
-
390
-
391
-
392
-
393
-
394
-
395
-
396
-
397
-
398
-
399
-
400
-
401
-
402
-
403
-
404
-
405
-
406
-
407
-
408
-
409
-
410
-
411
-
412
-
413
-
414
-
415
-
416
-
417
-
418
-
419
-
420
-
421
-
422
-
423
-
424
-
425
-
426
-
427
-
428
-
429
-
430
-
431
-
432
-
433
-
434
-
435
-
436
-
437
-
438
-
439
-
440
-
441
-
442
-
443
-
444
-
445
-
446
-
447
-
448
-
449
-
450
-
451
-
452
-
453
-
454
-
455
-
456
-
457
-
458
-
459
-
460
-
461
-
462
-
463
-
464
-
465
-
466
-
467
-
468
-
469
-
470
-
471
-
472
-
473
-
474
-
475
-
476
-
477
-
478
-
479
-
480
-
481
-
482
-
483
-
484
-
485
-
486
-
487
-
488
-
489
-
490
-
491
-
492
-
493
-
494
-
495
-
496
-
497
-
498
-
499
-
500
-
501
-
502
 |
 |
HSBC HOLDINGS PLC
127
Strategic Report Financial Review Corporate Governance Financial Statements Shareholder Information
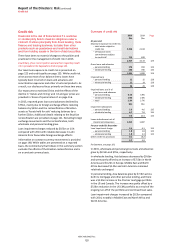
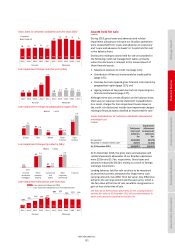
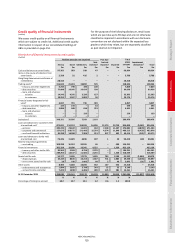
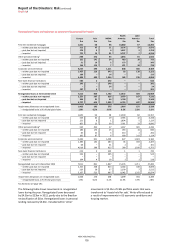
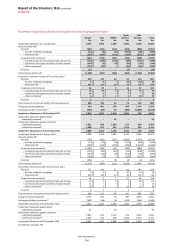
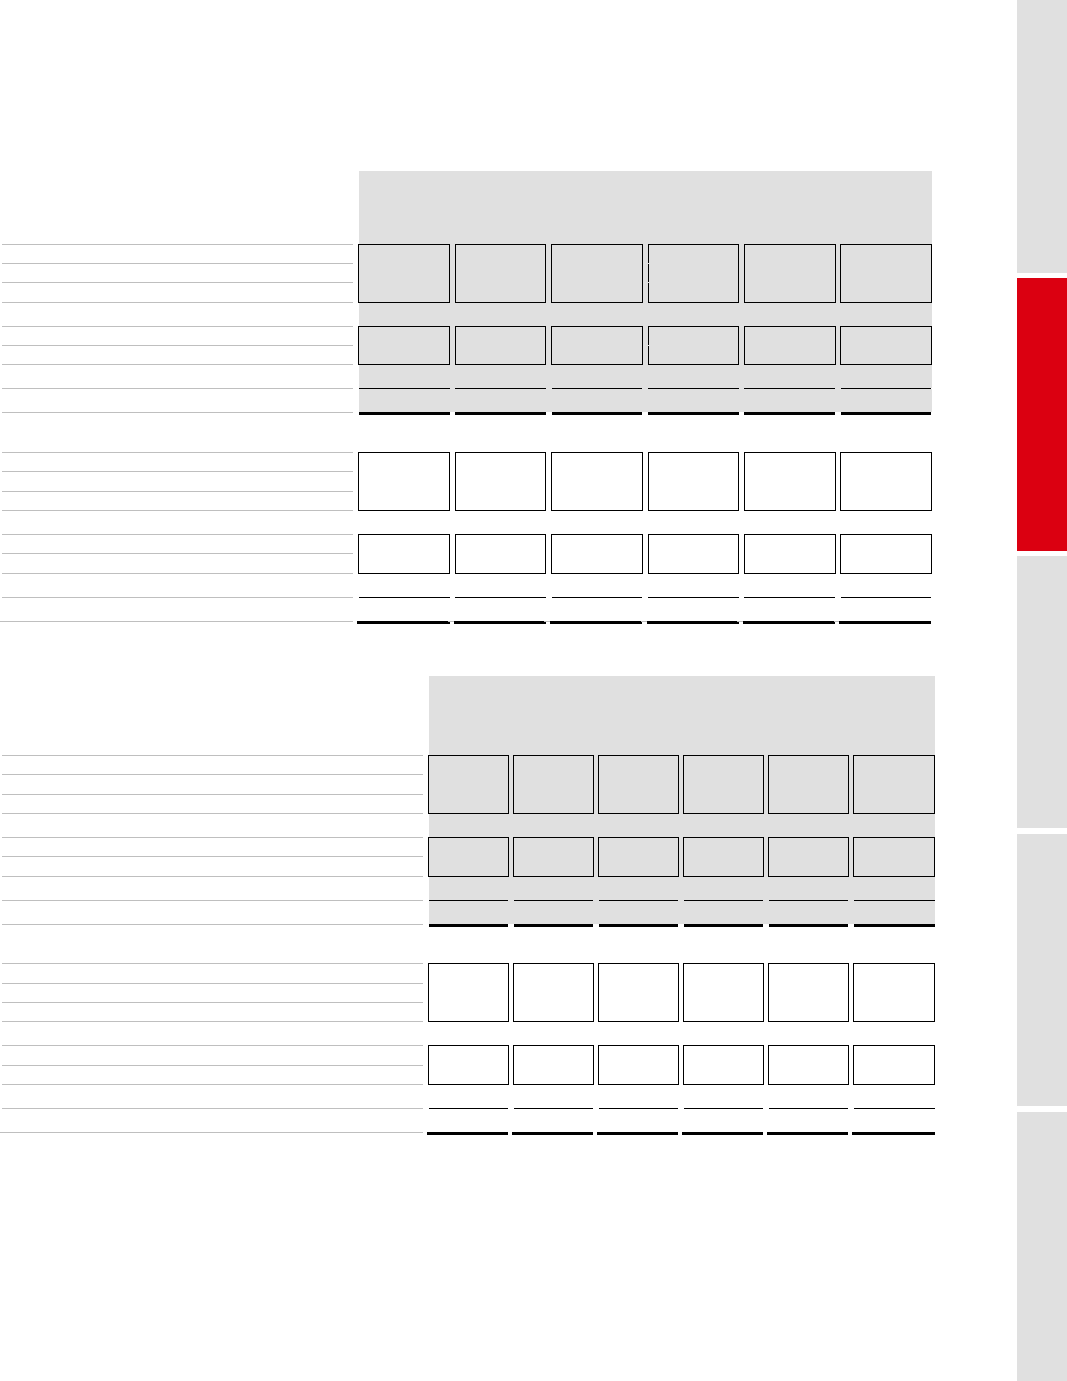
Past due but not impaired gross financial instruments
(Audited)
Past due but not impaired gross financial instruments are
those loans where, although customers have failed to make
payments in accordance with the contractual terms of their
facilities, they have not met the impaired loan criteria
described on page 128.
In personal lending, past due but not impaired balances
decreased, mainly due to the Brazilian reclassification and
the continued run-off and loan sales in the CML portfolio.
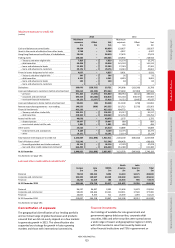
Past due but not impaired gross financial instruments by geographical region
(Audited)
Europe Asia MENA
North
America
Latin
America Total
$m $m $m $m $m $m
Loans and advances to customers held at amortised cost 1,928 3,405 909 5,392 545 12,179
–
personal 1,152 2,573 180 3,287 376 7,568
–
corporate and commercial 762 790 710 1,843 169 4,274
–
non-bank financial institutions 14 42 19 262
–
337
Assets held for sale
–
–
–
2 701 703
–
disposal group
–
–
–
–
701 701
–
non-current assets held for sale
–
–
–
2
–
2
Other financial instruments 10 39 15 80 4 148
At 31 December 2015 1,938 3,444 924 5,474 1,250 13,030
Loans and advances to customers held at amortised cost 2,409 4,260 704 4,634 1,350 13,357
–
personal 1,159 2,880 182 3,759 896 8,876
–
corporate and commercial 1,244 1,102 508 623 445 3,922
–
non-bank financial institutions 6 278 14 252 9 559
Assets held for sale
–
–
–
2
–
2
–
disposal group
–
–
–
–
–
–
–
non-current assets held for sale
–
–
–
2
–
2
Other financial instruments 6 52 31 95 25 209
At 31 December 2014 2,415 4,312 735 4,731 1,375 13,568
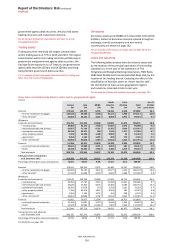
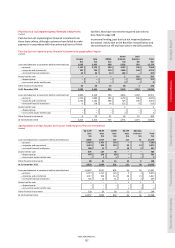
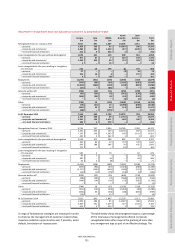
Ageing analysis of days for past due but not impaired gross financial instruments
(Audited)
Up to 29
days
30-59
days
60-89
days
90-179
days
180 days
and over Total
$m $m $m $m $m $m
Loans and advances to customers held at amortised cost 9,403 1,917 727 111 21 12,179
–
personal 5,665 1,401 502
–
–
7,568
–
corporate and commercial 3,432 505 225 93 19 4,274
–
non-bank financial institutions 306 11
–
18 2 337
Assets held for sale 476 137 90
–
–
703
–
disposal group 476 136 89
–
–
701
–
non-current assets held for sale
–
1 1
–
–
2
Other financial instruments 80 35 14 10 9 148
At 31 December 2015 9,959 2,089 831 121 30 13,030
Loans and advances to customers held at amortised cost 10,427 2,057 801 54 18 13,357
–
personal 6,477 1,717 676 5 1 8,876
–
corporate and commercial 3,417 328 114 48 15 3,922
–
non-bank financial institutions 533 12 11 1 2 559
Assets held for sale
–
–
–
1 1 2
–
disposal group
–
–
–
–
–
–
–
non-current assets held for sale
–
–
–
1 1 2
Other financial instruments 130 33 18 11 17 209
At 31 December 2014 10,557 2,090 819 66 36 13,568