HSBC 2015 Annual Report Download - page 386
Download and view the complete annual report
Please find page 386 of the 2015 HSBC annual report below. You can navigate through the pages in the report by either clicking on the pages listed below, or by using the keyword search tool below to find specific information within the annual report.-
 1
1 -
2
-
3
-
4
-
5
-
6
-
7
-
8
-
9
-
10
-
11
-
12
-
13
-
14
-
15
-
16
-
17
-
18
-
19
-
20
-
21
-
22
-
23
-
24
-
25
-
26
-
27
-
28
-
29
-
30
-
31
-
32
-
33
-
34
-
35
-
36
-
37
-
38
-
39
-
40
-
41
-
42
-
43
-
44
-
45
-
46
-
47
-
48
-
49
-
50
-
51
-
52
-
53
-
54
-
55
-
56
-
57
-
58
-
59
-
60
-
61
-
62
-
63
-
64
-
65
-
66
-
67
-
68
-
69
-
70
-
71
-
72
-
73
-
74
-
75
-
76
-
77
-
78
-
79
-
80
-
81
-
82
-
83
-
84
-
85
-
86
-
87
-
88
-
89
-
90
-
91
-
92
-
93
-
94
-
95
-
96
-
97
-
98
-
99
-
100
-
101
-
102
-
103
-
104
-
105
-
106
-
107
-
108
-
109
-
110
-
111
-
112
-
113
-
114
-
115
-
116
-
117
-
118
-
119
-
120
-
121
-
122
-
123
-
124
-
125
-
126
-
127
-
128
-
129
-
130
-
131
-
132
-
133
-
134
-
135
-
136
-
137
-
138
-
139
-
140
-
141
-
142
-
143
-
144
-
145
-
146
-
147
-
148
-
149
-
150
-
151
-
152
-
153
-
154
-
155
-
156
-
157
-
158
-
159
-
160
-
161
-
162
-
163
-
164
-
165
-
166
-
167
-
168
-
169
-
170
-
171
-
172
-
173
-
174
-
175
-
176
-
177
-
178
-
179
-
180
-
181
-
182
-
183
-
184
-
185
-
186
-
187
-
188
-
189
-
190
-
191
-
192
-
193
-
194
-
195
-
196
-
197
-
198
-
199
-
200
-
201
-
202
-
203
-
204
-
205
-
206
-
207
-
208
-
209
-
210
-
211
-
212
-
213
-
214
-
215
-
216
-
217
-
218
-
219
-
220
-
221
-
222
-
223
-
224
-
225
-
226
-
227
-
228
-
229
-
230
-
231
-
232
-
233
-
234
-
235
-
236
-
237
-
238
-
239
-
240
-
241
-
242
-
243
-
244
-
245
-
246
-
247
-
248
-
249
-
250
-
251
-
252
-
253
-
254
-
255
-
256
-
257
-
258
-
259
-
260
-
261
-
262
-
263
-
264
-
265
-
266
-
267
-
268
-
269
-
270
-
271
-
272
-
273
-
274
-
275
-
276
-
277
-
278
-
279
-
280
-
281
-
282
-
283
-
284
-
285
-
286
-
287
-
288
-
289
-
290
-
291
-
292
-
293
-
294
-
295
-
296
-
297
-
298
-
299
-
300
-
301
-
302
-
303
-
304
-
305
-
306
-
307
-
308
-
309
-
310
-
311
-
312
-
313
-
314
-
315
-
316
-
317
-
318
-
319
-
320
-
321
-
322
-
323
-
324
-
325
-
326
-
327
-
328
-
329
-
330
-
331
-
332
-
333
-
334
-
335
-
336
-
337
-
338
-
339
-
340
-
341
-
342
-
343
-
344
-
345
-
346
-
347
-
348
-
349
-
350
-
351
-
352
-
353
-
354
-
355
-
356
-
357
-
358
-
359
-
360
-
361
-
362
-
363
-
364
-
365
-
366
-
367
-
368
-
369
-
370
-
371
-
372
-
373
-
374
-
375
-
 376
376 -
 377
377 -
 378
378 -
 379
379 -
 380
380 -
 381
381 -
 382
382 -
 383
383 -
 384
384 -
 385
385 -
 386
386 -
 387
387 -
 388
388 -
 389
389 -
 390
390 -
 391
391 -
 392
392 -
 393
393 -
 394
394 -
 395
395 -
 396
396 -
397
-
398
-
399
-
400
-
401
-
402
-
403
-
404
-
405
-
406
-
407
-
408
-
409
-
410
-
411
-
412
-
413
-
414
-
415
-
416
-
417
-
418
-
419
-
420
-
421
-
422
-
423
-
424
-
425
-
426
-
427
-
428
-
429
-
430
-
431
-
432
-
433
-
434
-
435
-
436
-
437
-
438
-
439
-
440
-
441
-
442
-
443
-
444
-
445
-
446
-
447
-
448
-
449
-
450
-
451
-
452
-
453
-
454
-
455
-
456
-
457
-
458
-
459
-
460
-
461
-
462
-
463
-
464
-
465
-
466
-
467
-
468
-
469
-
470
-
471
-
472
-
473
-
474
-
475
-
476
-
477
-
478
-
479
-
480
-
481
-
482
-
483
-
484
-
485
-
486
-
487
-
488
-
489
-
490
-
491
-
492
-
493
-
494
-
495
-
496
-
497
-
498
-
499
-
500
-
501
-
502
 |
 |
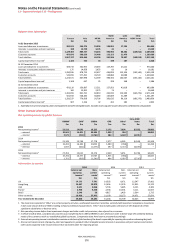
Notes on the Financial Statements (continued)
13 – Fair values of financial instruments carried at fair value
HSBC HOLDINGS PLC
384
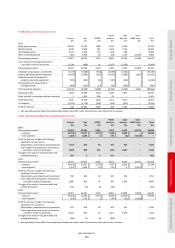
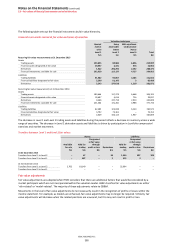
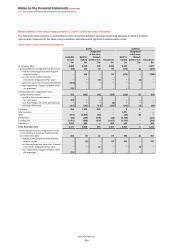
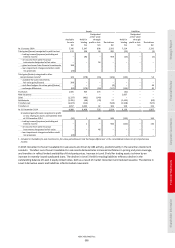
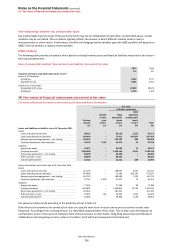
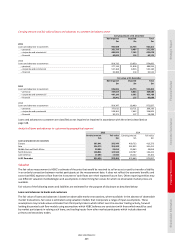
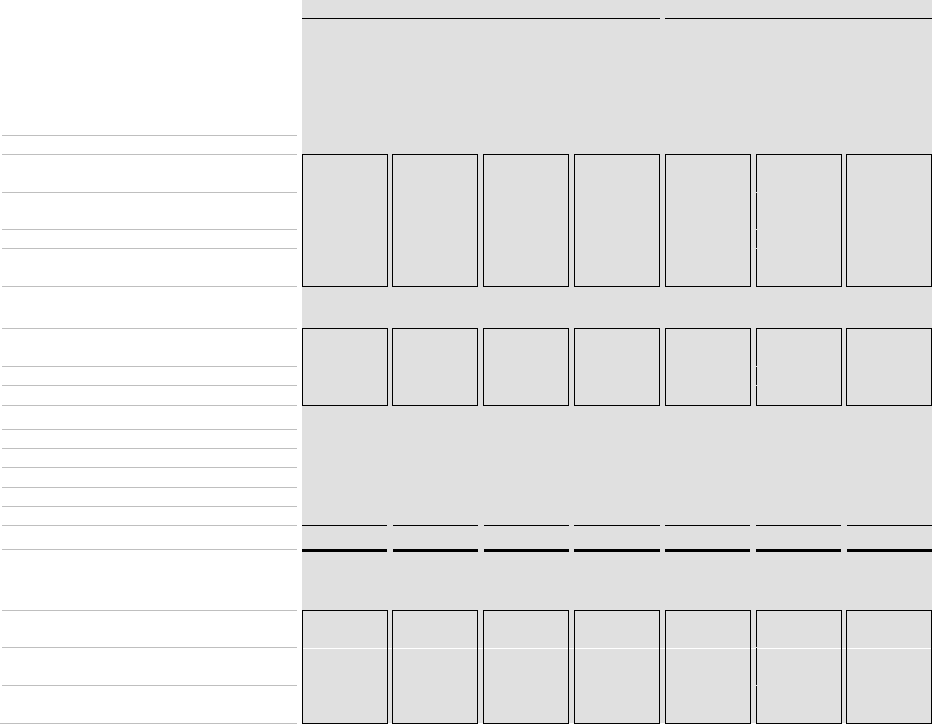
Reconciliation of fair value measurements in Level 3 of the fair value hierarchy
The following table provides a reconciliation of the movement between opening and closing balances of Level 3 financial
instruments, measured at fair value using a valuation technique with significant unobservable inputs:
Movement in Level 3 financial instruments
Assets Liabilities
Available
for sale
Held for
trading
Designated
at fair value
through
profit or loss Derivatives
Held for
trading
Designated
at fair value
through
profit or loss Derivatives
$m $m $m $m $m $m $m
At 1 January 2015 4,988 6,468 726 2,924 6,139
–
1,907
Total gains/(losses) recognised in profit or loss (34) 109 30 95 (573) (1) (209)
–
trading income/(expense) excluding net
interest income – 109 – 95 (573) – (209)
–
net income from other financial
instruments designated at fair value – – 30 – – (1) –
–
gains less losses from financial investments (269)
–
–
–
–
–
–
–
loan impairment charges and other credit
risk provisions 235 – – – – – –
Total gains/(losses) recognised in other
comprehensive income1 226 (192) (11) (126) (118) (1) (64)
–
available-for-sale investments:
fair value gains 393 – – – – – –
–
cash flow hedges: fair value gains/(losses)
–
–
–
(4)
–
–
–
–
exchange differences (167) (192) (11) (122) (118) (1) (64)
Purchases 594 1,745 250
–
2 9
–
New issuances
–
–
–
–
1,471
–
–
Sales (757) (1,206) (50)
–
(66) (4)
–
Settlements (32) (146) (135) (38) (1,260)
–
(241)
Transfers out (1,471) (206) (336) (1,015) (1,743)
–
(283)
Transfers in 1,213 284
–
422 433
–
100
At 31 December 2015 4,727 6,856 474 2,262 4,285 3 1,210
Unrealised gains/(losses) recognised in profit
or loss relating to assets and liabilities held
at 31 December 2015 235 (9) 12 89 384 (1) 267
–
trading income/(expense) excluding net
interest income – (9) – 89 384 – 267
–
net income/(expense) from other financial
instruments designated at fair value – – 12 – – (1) –
–
loan impairment charges and other credit
risk provisions 235 – – – – – –