HSBC 2015 Annual Report Download - page 135
Download and view the complete annual report
Please find page 135 of the 2015 HSBC annual report below. You can navigate through the pages in the report by either clicking on the pages listed below, or by using the keyword search tool below to find specific information within the annual report.-
 1
1 -
2
-
3
-
4
-
5
-
6
-
7
-
8
-
9
-
10
-
11
-
12
-
13
-
14
-
15
-
16
-
17
-
18
-
19
-
20
-
21
-
22
-
23
-
24
-
25
-
26
-
27
-
28
-
29
-
30
-
31
-
32
-
33
-
34
-
35
-
36
-
37
-
38
-
39
-
40
-
41
-
42
-
43
-
44
-
45
-
46
-
47
-
48
-
49
-
50
-
51
-
52
-
53
-
54
-
55
-
56
-
57
-
58
-
59
-
60
-
61
-
62
-
63
-
64
-
65
-
66
-
67
-
68
-
69
-
70
-
71
-
72
-
73
-
74
-
75
-
76
-
77
-
78
-
79
-
80
-
81
-
82
-
83
-
84
-
85
-
86
-
87
-
88
-
89
-
90
-
91
-
92
-
93
-
94
-
95
-
96
-
97
-
98
-
99
-
100
-
101
-
102
-
103
-
104
-
105
-
106
-
107
-
108
-
109
-
110
-
111
-
112
-
113
-
114
-
115
-
116
-
117
-
118
-
119
-
120
-
121
-
122
-
123
-
124
-
 125
125 -
 126
126 -
 127
127 -
 128
128 -
 129
129 -
 130
130 -
 131
131 -
 132
132 -
 133
133 -
 134
134 -
 135
135 -
 136
136 -
 137
137 -
 138
138 -
 139
139 -
 140
140 -
 141
141 -
 142
142 -
 143
143 -
 144
144 -
 145
145 -
146
-
147
-
148
-
149
-
150
-
151
-
152
-
153
-
154
-
155
-
156
-
157
-
158
-
159
-
160
-
161
-
162
-
163
-
164
-
165
-
166
-
167
-
168
-
169
-
170
-
171
-
172
-
173
-
174
-
175
-
176
-
177
-
178
-
179
-
180
-
181
-
182
-
183
-
184
-
185
-
186
-
187
-
188
-
189
-
190
-
191
-
192
-
193
-
194
-
195
-
196
-
197
-
198
-
199
-
200
-
201
-
202
-
203
-
204
-
205
-
206
-
207
-
208
-
209
-
210
-
211
-
212
-
213
-
214
-
215
-
216
-
217
-
218
-
219
-
220
-
221
-
222
-
223
-
224
-
225
-
226
-
227
-
228
-
229
-
230
-
231
-
232
-
233
-
234
-
235
-
236
-
237
-
238
-
239
-
240
-
241
-
242
-
243
-
244
-
245
-
246
-
247
-
248
-
249
-
250
-
251
-
252
-
253
-
254
-
255
-
256
-
257
-
258
-
259
-
260
-
261
-
262
-
263
-
264
-
265
-
266
-
267
-
268
-
269
-
270
-
271
-
272
-
273
-
274
-
275
-
276
-
277
-
278
-
279
-
280
-
281
-
282
-
283
-
284
-
285
-
286
-
287
-
288
-
289
-
290
-
291
-
292
-
293
-
294
-
295
-
296
-
297
-
298
-
299
-
300
-
301
-
302
-
303
-
304
-
305
-
306
-
307
-
308
-
309
-
310
-
311
-
312
-
313
-
314
-
315
-
316
-
317
-
318
-
319
-
320
-
321
-
322
-
323
-
324
-
325
-
326
-
327
-
328
-
329
-
330
-
331
-
332
-
333
-
334
-
335
-
336
-
337
-
338
-
339
-
340
-
341
-
342
-
343
-
344
-
345
-
346
-
347
-
348
-
349
-
350
-
351
-
352
-
353
-
354
-
355
-
356
-
357
-
358
-
359
-
360
-
361
-
362
-
363
-
364
-
365
-
366
-
367
-
368
-
369
-
370
-
371
-
372
-
373
-
374
-
375
-
376
-
377
-
378
-
379
-
380
-
381
-
382
-
383
-
384
-
385
-
386
-
387
-
388
-
389
-
390
-
391
-
392
-
393
-
394
-
395
-
396
-
397
-
398
-
399
-
400
-
401
-
402
-
403
-
404
-
405
-
406
-
407
-
408
-
409
-
410
-
411
-
412
-
413
-
414
-
415
-
416
-
417
-
418
-
419
-
420
-
421
-
422
-
423
-
424
-
425
-
426
-
427
-
428
-
429
-
430
-
431
-
432
-
433
-
434
-
435
-
436
-
437
-
438
-
439
-
440
-
441
-
442
-
443
-
444
-
445
-
446
-
447
-
448
-
449
-
450
-
451
-
452
-
453
-
454
-
455
-
456
-
457
-
458
-
459
-
460
-
461
-
462
-
463
-
464
-
465
-
466
-
467
-
468
-
469
-
470
-
471
-
472
-
473
-
474
-
475
-
476
-
477
-
478
-
479
-
480
-
481
-
482
-
483
-
484
-
485
-
486
-
487
-
488
-
489
-
490
-
491
-
492
-
493
-
494
-
495
-
496
-
497
-
498
-
499
-
500
-
501
-
502
 |
 |

HSBC HOLDINGS PLC
133
Strategic Report Financial Review Corporate Governance Financial Statements Shareholder Information
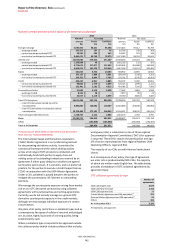
Europe Asia MENA
North
America
Latin
America Total
$m $m $m $m $m $m
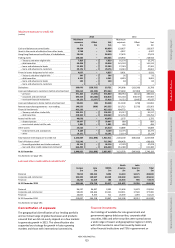
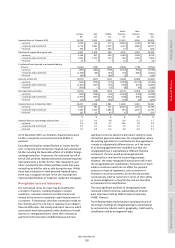
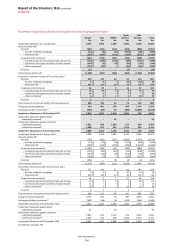
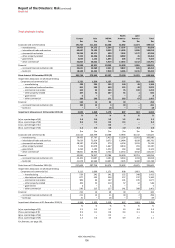
Individually assessed impairment allowances 617 351 32 190 590 1,780
–
new allowances 1,112 542 134 298 738 2,824
–
release of allowances no longer required (486) (171) (95) (88) (90) (930)
–
recoveries of amounts previously written off (9) (20) (7) (20) (58) (114)
Collectively assessed impairment allowances10 462 293 (33) 110 1,443 2,275
–
new allowances net of allowance releases 757 426 2 205 1,726 3,116
–
recoveries of amounts previously written off (295) (133) (35) (95) (283) (841)
Total loan impairment charge for the year ended
31 December 2014 1,079 644 (1) 300 2,033 4,055
For footnote, see page 191.
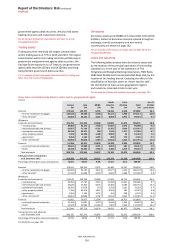
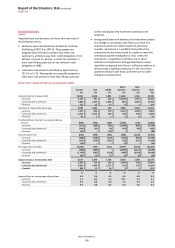
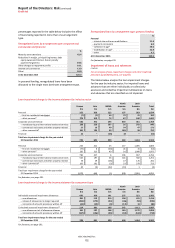
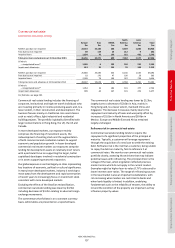
On a reported basis, loan impairment charges of $3.6bn
were $0.5bn lower than in 2014, primarily due to favourable
currency translation in Latin America and Europe.
The commentary that follows is on a constant currency basis,
while tables are presented on a reported basis.
Loan impairment charges increased by $219m compared
with 2014. Notably, in the fourth quarter of 2015, our loan
impairment charges increased compared with the third
quarter following a rise in individually assessed loan
impairment charges in a small number of countries. This was
reflective of specific circumstances associated with those
countries with no common underlying theme. In addition,
we increased our collectively assessed loan impairment
allowances on exposures related to the oil and gas industry
by $0.2bn. This was primarily in North America, Middle East
and North Africa, and Asia.
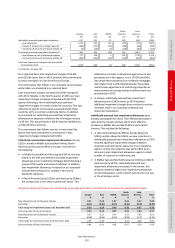
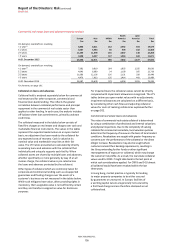
The commentary that follows sets out in more detail the
factors that have contributed to movements in loan
impairment charges compared with 2014.
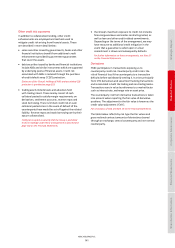
Collectively assessed loan impairment allowances rose by
$221m, mainly in Middle East and North Africa, North
America and Asia, partly offset in Europe. It arose from
the following:
• in Middle East and North Africa (up by $167m), this was
mainly in the UAE and reflected increased impairment
allowances on our residential mortgage book following a
review of the quality and value of collateral. In addition,
loan impairment allowances increased on our corporate
and commercial exposures, notably in the oil and
foodstuffs industries;
• in North America (up by $132m) and Asia (up by $108m),
the increase was in the ‘other commercial’ sector. This
reflected an increase in allowances against our oil and
gas exposures in the regions. In our US CML portfolio,
loan impairment allowances on residential mortgages
were higher than in 2014 following lower favourable
market value adjustments of underlying properties as
improvements in housing market conditions were less
pronounced in 2015.
• in Europe, collectively assessed loan impairment
allowances were $192m lower as 2014 included
additional impairment charges from revisions to certain
estimates used in our corporate collective loan
impairment calculation.
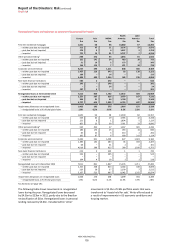
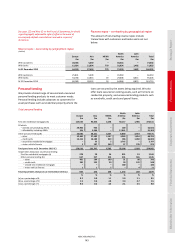
Individually assessed loan impairment allowances were
broadly unchanged from 2014. This reflected decreases in
Latin America, Europe and Asia which were offset by
increases in Middle East and North Africa and in North
America. This included the following:
• in Latin America (down by $95m), Europe (down by
$44m) and Asia (down by $44m), we saw reductions in
individually assessed loan impairment allowances as 2014
included significant impairment charges related to
corporate and commercial exposures in our respective
regions. In Asia, the reduction was partly offset by an
increase in loan impairment allowances against a small
number of customers in Indonesia; and
• in Middle East and North Africa (up by $134m) and North
America (up by $47m), individually assessed loan
impairment allowances increased. In the former, this
primarily related to higher loan impairment allowances
on food wholesalers, while in North America the rise was
in the oil and gas sector.
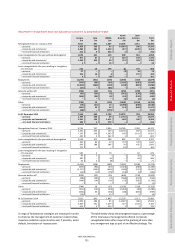
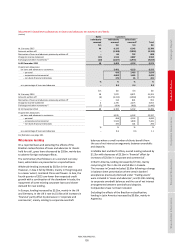
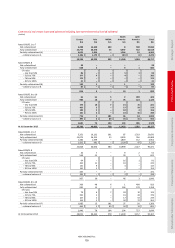
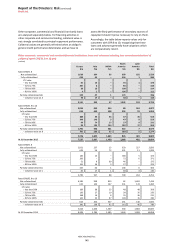
Charge for impairment losses as a percentage of average gross loans and advances to customers by geographical region
Europe Asia MENA
North
America
Latin
America Total
%%%% % %
New allowances net of allowance releases 0.31 0.23 1.07 0.41 5.37 0.48
Recoveries (0.11) (0.05) (0.11) (0.06) (0.50) (0.09)
Total charge for impairment losses at 31 December 2015 0.20 0.18 0.96 0.35 4.87 0.39
Amount written off net of recoveries 0.25 0.12 0.97 0.45 3.94 0.37
New allowances net of allowance releases 0.37 0.22 0.14 0.32 5.00 0.53
Recoveries (0.08) (0.04) (0.14) (0.09) (0.72) (0.10)
Total charge for impairment losses at 31 December 2014 0.29 0.18
–
0.23 4.28 0.43
Amount written off net of recoveries 0.49 0.13 0.58 0.97 3.59 0.58