Cigna 2009 Annual Report Download - page 98
Download and view the complete annual report
Please find page 98 of the 2009 Cigna annual report below. You can navigate through the pages in the report by either clicking on the pages listed below, or by using the keyword search tool below to find specific information within the annual report.-
 1
1 -
2
-
3
-
4
-
5
-
6
-
7
-
8
-
9
-
10
-
11
-
12
-
13
-
14
-
15
-
16
-
17
-
18
-
19
-
20
-
21
-
22
-
23
-
24
-
25
-
26
-
27
-
28
-
29
-
30
-
31
-
32
-
33
-
34
-
35
-
36
-
37
-
38
-
39
-
40
-
41
-
42
-
43
-
44
-
45
-
46
-
47
-
48
-
49
-
50
-
51
-
52
-
53
-
54
-
55
-
56
-
57
-
58
-
59
-
60
-
61
-
62
-
63
-
64
-
65
-
66
-
67
-
68
-
69
-
70
-
71
-
72
-
73
-
74
-
75
-
76
-
77
-
78
-
79
-
80
-
81
-
82
-
83
-
84
-
85
-
86
-
87
-
 88
88 -
 89
89 -
 90
90 -
 91
91 -
 92
92 -
 93
93 -
 94
94 -
 95
95 -
 96
96 -
 97
97 -
 98
98 -
 99
99 -
 100
100 -
 101
101 -
 102
102 -
 103
103 -
 104
104 -
 105
105 -
 106
106 -
 107
107 -
 108
108 -
109
-
110
-
111
-
112
-
113
-
114
-
115
-
116
-
117
-
118
-
119
-
120
-
121
-
122
-
123
-
124
-
125
-
126
-
127
-
128
-
129
-
130
-
131
-
132
-
133
-
134
-
135
-
136
-
137
-
138
-
139
-
140
-
141
-
142
-
143
-
144
-
145
-
146
-
147
-
148
-
149
-
150
-
151
-
152
-
153
-
154
-
155
-
156
-
157
-
158
-
159
-
160
-
161
-
162
-
163
-
164
-
165
-
166
-
167
-
168
-
169
-
170
-
171
-
172
-
173
-
174
-
175
-
176
-
177
-
178
-
179
-
180
-
181
-
182
-
183
-
184
-
185
-
186
-
187
-
188
-
189
-
190
-
191
-
192
-
193
-
194
-
195
-
196
-
197
-
198
-
199
-
200
-
201
-
202
-
203
-
204
-
205
-
206
-
207
-
208
-
209
-
210
-
211
-
212
-
213
-
214
-
215
-
216
-
217
-
218
-
219
-
220
-
221
-
222
-
223
-
224
-
225
-
226
-
227
-
228
 |
 |

78
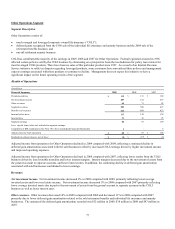
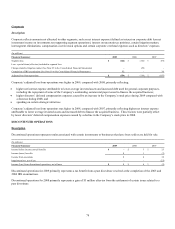
Corporate
Description
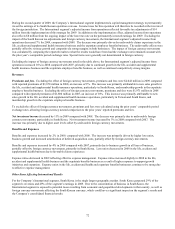
Corporate reflects amounts not allocated to other segments, such as net interest expense (defined as interest on corporate debt less net
investment income on investments not supporting segment operations), interest on uncertain tax positions, certain litigation matters,
intersegment eliminations, compensation cost for stock options and certain corporate overhead expenses such as directors’ expenses.
(In millions)
Financial Summary 2009 2008 2007
Segment loss $(142) $(162) $(97)
Less: special items (after-tax) included in segment loss:
Charge related to litigation matter (See Note 23 to the Consolidated Financial Statements) - (52) -
Completion of IRS examination (See Note 19 to the Consolidated Financial Statements) 12 - 10
Adjusted loss from operations $(154) $(110) $(107)
Corporate’s adjusted loss from operations was higher in 2009, compared with 2008, primarily reflecting:
x higher net interest expense attributable to lower average invested assets and increased debt used for general corporate purposes,
including the repayment of some of the Company’s outstanding commercial paper issued to finance the acquired business;
x higher directors’ deferred compensation expenses caused by an increase in the Company’s stock price during 2009 compared with
a decrease during 2008; and
x spending on certain strategic initiatives.
Corporate’s adjusted loss from operations was higher in 2008, compared with 2007, primarily reflecting higher net interest expense
attributable to lower average invested assets and increased debt to finance the acquired business. These factors were partially offset
by lower directors’ deferred compensation expenses caused by a decline in the Company’s stock price in 2008.
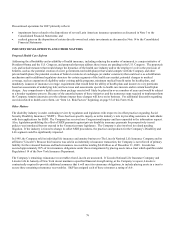
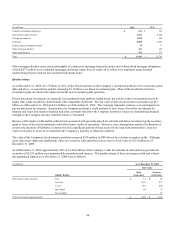
DISCONTINUED OPERATIONS
Description
Discontinued operations represent results associated with certain investments or businesses that have been sold or are held for sale.
(In millions)
Financial Summary 2009 2008 2007
Income before income (taxes) benefits $ - $ 3 $ 25
Income (taxes) benefits 1 1 (7)
Income from operations 1 4 18
Impairment loss, net of tax - - (23)
Income (loss) from discontinued operations, net of taxes $ 1 $ 4 $(5)
Discontinued operations for 2009 primarily represents a tax benefit from a past divestiture resolved at the completion of the 2005 and
2006 IRS examinations.
Discontinued operations for 2008 primarily represents a gain of $3 million after-tax from the settlement of certain issues related to a
past divestiture.