Cigna 2009 Annual Report Download - page 80
Download and view the complete annual report
Please find page 80 of the 2009 Cigna annual report below. You can navigate through the pages in the report by either clicking on the pages listed below, or by using the keyword search tool below to find specific information within the annual report.
60
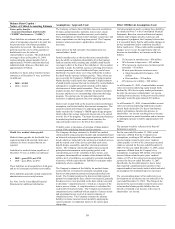
Balance Sheet Caption /
Nature of Critical Accounting Estimate Assumptions / Approach Used Effect if Different Assumptions Used
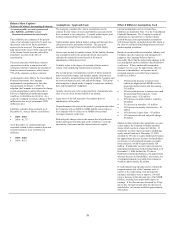
The accumulated unrecognized actuarial loss of $1.6 billion at
December 31, 2009 primarily reflects the significant decline in
the value of equity securities during 2008. The actuarial loss is
adjusted for unrecognized changes in market-related asset
values and amortized over the average remaining life
expectancy of plan participants if the adjusted loss exceeds 10%
of the market-related value of plan assets or 10% of the
projected benefit obligation, whichever is greater. As of
December 31, 2009, approximately $0.7 billion of the adjusted
actuarial loss exceeded 10% of the projected benefit obligation.
As a result, approximately $16 million after-tax will be
expensed in 2010 net income. For the year ended December 31,
2009, $22 million after-tax was expensed in net income.
If the December 31, 2009 fair values of domestic
qualified plan assets decreased by 10%, the accrued
pension benefit liability would increase by
approximately $285 million as of December 31,
2009 resulting in an after-tax decrease to
shareholders’ equity of approximately $185 million.
An increase in these key assumptions would result in
impacts to annual pension costs, the accrued pension
liability and shareholders’ equity in an opposite
direction, but similar amounts.
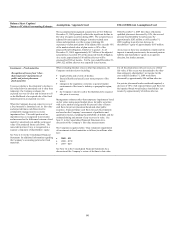
Investments – Fixed maturities
Recognition of losses from “other-
than-temporary” impairments of
public and private placement
fixed maturities
To assess whether a fixed maturity’s decline in
fair value below its amortized cost is other than
temporary, the Company evaluates the
expected recovery in value and its intent to sell
or the likelihood of a required sale of the fixed
maturity prior to an expected recovery.
When the Company does not expect to recover
a fixed maturity’s amortized cost, its fair value
and expected future cash flows must be
estimated by management to record an
impairment loss. The credit portion of an
impairment loss is recognized in net income
and measured as the difference between a fixed
maturity’s amortized cost and the net present
value of its projected future cash flows. The
non-credit portion, if any, is recognized in a
separate component of shareholders’ equity.
See Note 2 (C) to the Consolidated Financial
Statements for additional information regarding
the Company’s accounting policies for fixed
maturities.
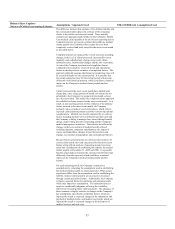
When evaluating whether a loss is other than temporary, the
Company considers factors including;
x length of time and severity of decline;
x financial health and specific near term prospects of the
issuer;
x changes in the regulatory, economic or general market
environment of the issuer’s industry or geographic region;
and
x the Company’s intent to sell or the likelihood of a required
sale prior to recovery.
Management estimates other-than-temporary impairments based
on fair values using quoted market prices for public securities
with active markets and generally the present value of future
cash flows for private placement bonds and other public
securities. Expected future cash flows for each fixed maturity
are based on the Company’s assessment of qualitative and
quantitative factors, including the probability of default, and the
estimated timing and amount of any recovery in value. See
Note 11 to the Consolidated Financial Statements for a
discussion of the Company’s fair value measurements.
The Company recognized other –than- temporary impairments
of investments in fixed maturities as follows (in millions, after-
tax):
x 2009 – $31
x 2008 – $138
x 2007 – $20
See Note 12 to the Consolidated Financial Statements for a
discussion of the Company’s review of declines in fair value.
For all fixed maturities with cost in excess of their
fair value, if this excess was determined to be other-
than-temporary, shareholders’ net income for the
year ended December 31, 2009 would have
decreased by approximately $86 million after-tax.
For private placement bonds considered impaired, a
decrease of 10% of all expected future cash flows for
the impaired bonds would reduce shareholders’ net
income by approximately $2 million after-tax.


