Cigna 2009 Annual Report Download - page 97
Download and view the complete annual report
Please find page 97 of the 2009 Cigna annual report below. You can navigate through the pages in the report by either clicking on the pages listed below, or by using the keyword search tool below to find specific information within the annual report.-
 1
1 -
2
-
3
-
4
-
5
-
6
-
7
-
8
-
9
-
10
-
11
-
12
-
13
-
14
-
15
-
16
-
17
-
18
-
19
-
20
-
21
-
22
-
23
-
24
-
25
-
26
-
27
-
28
-
29
-
30
-
31
-
32
-
33
-
34
-
35
-
36
-
37
-
38
-
39
-
40
-
41
-
42
-
43
-
44
-
45
-
46
-
47
-
48
-
49
-
50
-
51
-
52
-
53
-
54
-
55
-
56
-
57
-
58
-
59
-
60
-
61
-
62
-
63
-
64
-
65
-
66
-
67
-
68
-
69
-
70
-
71
-
72
-
73
-
74
-
75
-
76
-
77
-
78
-
79
-
80
-
81
-
82
-
83
-
84
-
85
-
86
-
 87
87 -
 88
88 -
 89
89 -
 90
90 -
 91
91 -
 92
92 -
 93
93 -
 94
94 -
 95
95 -
 96
96 -
 97
97 -
 98
98 -
 99
99 -
 100
100 -
 101
101 -
 102
102 -
 103
103 -
 104
104 -
 105
105 -
 106
106 -
 107
107 -
108
-
109
-
110
-
111
-
112
-
113
-
114
-
115
-
116
-
117
-
118
-
119
-
120
-
121
-
122
-
123
-
124
-
125
-
126
-
127
-
128
-
129
-
130
-
131
-
132
-
133
-
134
-
135
-
136
-
137
-
138
-
139
-
140
-
141
-
142
-
143
-
144
-
145
-
146
-
147
-
148
-
149
-
150
-
151
-
152
-
153
-
154
-
155
-
156
-
157
-
158
-
159
-
160
-
161
-
162
-
163
-
164
-
165
-
166
-
167
-
168
-
169
-
170
-
171
-
172
-
173
-
174
-
175
-
176
-
177
-
178
-
179
-
180
-
181
-
182
-
183
-
184
-
185
-
186
-
187
-
188
-
189
-
190
-
191
-
192
-
193
-
194
-
195
-
196
-
197
-
198
-
199
-
200
-
201
-
202
-
203
-
204
-
205
-
206
-
207
-
208
-
209
-
210
-
211
-
212
-
213
-
214
-
215
-
216
-
217
-
218
-
219
-
220
-
221
-
222
-
223
-
224
-
225
-
226
-
227
-
228
 |
 |

77
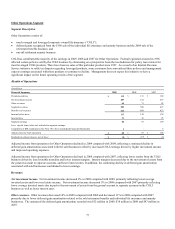
Other Operations Segment
Segment Description
Other Operations consist of:
x non-leveraged and leveraged corporate–owned life insurance (“COLI”);
x deferred gains recognized from the 1998 sale of the individual life insurance and annuity business and the 2004 sale of the
retirement benefits business; and
x run-off settlement annuity business.
COLI has contributed the majority of the earnings in 2009, 2008 and 2007 for Other Operations. Federal legislation enacted in 1996
affected certain policies sold by the COLI business by eliminating on a prospective basis the tax deduction for policy loan interest for
most leveraged COLI products. There have been no sales of this particular product since 1997. As a result of an Internal Revenue
Service initiative to settle tax disputes regarding leveraged products, some customers have surrendered their policies and management
expects earnings associated with these products to continue to decline. Management does not expect this initiative to have a
significant impact on the future operating results of the segment.
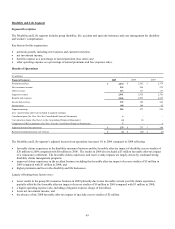
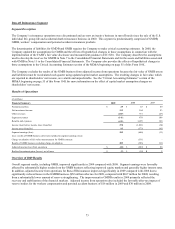
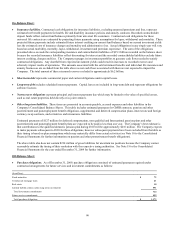
Results of Operations
(In millions)
Financial Summary 2009 2008 2007
Premiums and fees $ 112 $ 113 $ 108
Net investment income 407 414 437
Other revenues 64 71 82
Segment revenues 583 598 627
Benefits and expenses 466 468 473
Income before taxes 117 130 154
Income taxes 31 43 45
Segment earnings 86 87 109
Less: special items (after-tax) included in segment earnings:
Completion of IRS examination (See Note 19 to the Consolidated Financial Statements) 1 - 5
Adjusted income from operations $ 85 $ 87 $ 104
Realized investment (losses), net of taxes $ (6) $(27) $(2)
Adjusted income from operations for Other Operations declined in 2009 compared with 2008, reflecting a continued decline in
deferred gain amortization associated with the sold businesses offset by increased COLI earnings driven by higher investment income
and improved operating expenses.
Adjusted income from operations for Other Operations declined in 2008 compared with 2007, reflecting lower results from the COLI
business driven by less favorable mortality and lower interest margins. Interest margins decreased due to the movement of assets from
the general account to separate accounts, and lower interest rates. In addition, the continuing decline in deferred gain amortization
associated with sold businesses contributed to lower earnings.
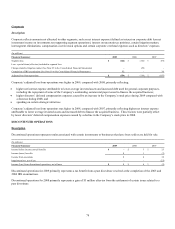
Revenues
Net investment income. Net investment income decreased 2% in 2009 compared with 2008, primarily reflecting lower average
invested assets and lower real estate income. Net investment income decreased 5% in 2008 compared with 2007 primarily reflecting
lower average invested assets due in part to the movement of assets from the general account to separate accounts in the COLI
business as well as lower interest rates.
Other revenues. Other revenues decreased 10% in 2009 compared with 2008 and decreased 13% in 2008 compared with 2007
primarily due to lower deferred gain amortization related to the sold retirement benefits and individual life insurance and annuity
businesses. The amount of the deferred gain amortization recorded was $32 million in 2009, $38 million in 2008 and $47 million in
2007.