Cigna 2009 Annual Report Download - page 182
Download and view the complete annual report
Please find page 182 of the 2009 Cigna annual report below. You can navigate through the pages in the report by either clicking on the pages listed below, or by using the keyword search tool below to find specific information within the annual report.-
 1
1 -
2
-
3
-
4
-
5
-
6
-
7
-
8
-
9
-
10
-
11
-
12
-
13
-
14
-
15
-
16
-
17
-
18
-
19
-
20
-
21
-
22
-
23
-
24
-
25
-
26
-
27
-
28
-
29
-
30
-
31
-
32
-
33
-
34
-
35
-
36
-
37
-
38
-
39
-
40
-
41
-
42
-
43
-
44
-
45
-
46
-
47
-
48
-
49
-
50
-
51
-
52
-
53
-
54
-
55
-
56
-
57
-
58
-
59
-
60
-
61
-
62
-
63
-
64
-
65
-
66
-
67
-
68
-
69
-
70
-
71
-
72
-
73
-
74
-
75
-
76
-
77
-
78
-
79
-
80
-
81
-
82
-
83
-
84
-
85
-
86
-
87
-
88
-
89
-
90
-
91
-
92
-
93
-
94
-
95
-
96
-
97
-
98
-
99
-
100
-
101
-
102
-
103
-
104
-
105
-
106
-
107
-
108
-
109
-
110
-
111
-
112
-
113
-
114
-
115
-
116
-
117
-
118
-
119
-
120
-
121
-
122
-
123
-
124
-
125
-
126
-
127
-
128
-
129
-
130
-
131
-
132
-
133
-
134
-
135
-
136
-
137
-
138
-
139
-
140
-
141
-
142
-
143
-
144
-
145
-
146
-
147
-
148
-
149
-
150
-
151
-
152
-
153
-
154
-
155
-
156
-
157
-
158
-
159
-
160
-
161
-
162
-
163
-
164
-
165
-
166
-
167
-
168
-
169
-
170
-
171
-
 172
172 -
 173
173 -
 174
174 -
 175
175 -
 176
176 -
 177
177 -
 178
178 -
 179
179 -
 180
180 -
 181
181 -
 182
182 -
 183
183 -
 184
184 -
 185
185 -
 186
186 -
 187
187 -
 188
188 -
 189
189 -
 190
190 -
 191
191 -
 192
192 -
193
-
194
-
195
-
196
-
197
-
198
-
199
-
200
-
201
-
202
-
203
-
204
-
205
-
206
-
207
-
208
-
209
-
210
-
211
-
212
-
213
-
214
-
215
-
216
-
217
-
218
-
219
-
220
-
221
-
222
-
223
-
224
-
225
-
226
-
227
-
228
 |
 |

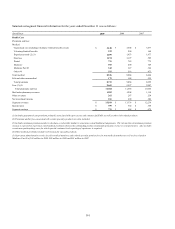
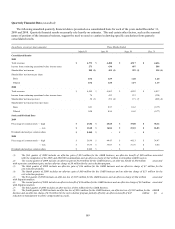
162
(In millions) 2009 2008 2007
Disability and Life
Premiums and fees:
Life $ 1,301 $ 1,261 $ 1,148
Disability 1,057 1,004 942
Other 276 297 284
Total 2,634 2,562 2,374
Other revenues 113 117 131
Net investment income 244 256 276
Segment revenues $ 2,991 $ 2,935 $ 2,781
Income taxes $ 109 $ 109 $ 92
Segment earnings $ 284 $ 273 $ 254
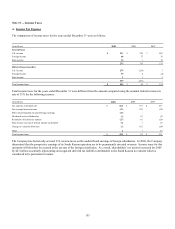
International
Premiums and fees:
Health Care $ 884 $ 856 $ 845
Life, Accident and Health 998 1,014 955
Total 1,882 1,870 1,800
Other revenues 22 18 7
Net investment income 69 79 77
Segment revenues $ 1,973 $ 1,967 $ 1,884
Income taxes $ 70 $ 104 $ 96
Equity in income of investees $ 11 $ 8 $ 3
Segment earnings $ 183 $ 182 $ 176
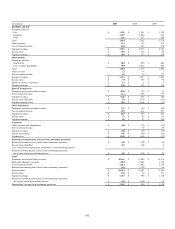
Run-off Reinsurance
Premiums and fees and other revenues $(254) $ 374 $ 13
Net investment income 113 104 93
Segment revenues $(141) $ 478 $ 106
Income taxes (benefits) $ 93 $(375) $(43)
Segment earnings (loss) $ 185 $(646) $(11)
Other Operations
Premiums and fees and other revenues $ 176 $ 184 $ 190
Net investment income 407 414 437
Segment revenues $ 583 $ 598 $ 627
Income taxes $ 31 $ 43 $ 45
Segment earnings $ 86 $ 87 $ 109
Corporate
Other revenues and eliminations $(58) $(53) $(55)
Net investment income - 10 29
Segment revenues $(58) $(43) $(26)
Income tax benefits $(91) $(81) $(42)
Segment loss $(142) $(162) $(97)
Realized investment gains (losses) from continuing operations
Realized investment gains (losses) from continuing operations $(43) $(170) $ 16
Income taxes (benefits) (17) (60) 5
Less: Realized investment gain attributable to noncontrolling interest - - 1
Realized investment gains (losses) from continuing operations,
net of taxes and noncontrolling interest $(26) $(110) $ 10
Total
Premiums and fees and other revenues $ 16,161 $ 17,004 $ 15,376
Mail order pharmacy revenues 1,282 1,204 1,118
Net investment income 1,014 1,063 1,114
Realized investment gains (losses) from continuing operations (43) (170) 16
Total revenues $ 18,414 $ 19,101 $ 17,624
Income taxes $ 594 $ 92 $ 511
Segment earnings $ 1,327 $ 398 $ 1,110
Realized investment gains (losses) from continuing operations,
net of taxes and noncontrolling interest $(26) $(110) $ 10
Shareholders' income from continuing operations $ 1,301 $ 288 $ 1,120