Cigna 2009 Annual Report Download - page 149
Download and view the complete annual report
Please find page 149 of the 2009 Cigna annual report below. You can navigate through the pages in the report by either clicking on the pages listed below, or by using the keyword search tool below to find specific information within the annual report.-
 1
1 -
2
-
3
-
4
-
5
-
6
-
7
-
8
-
9
-
10
-
11
-
12
-
13
-
14
-
15
-
16
-
17
-
18
-
19
-
20
-
21
-
22
-
23
-
24
-
25
-
26
-
27
-
28
-
29
-
30
-
31
-
32
-
33
-
34
-
35
-
36
-
37
-
38
-
39
-
40
-
41
-
42
-
43
-
44
-
45
-
46
-
47
-
48
-
49
-
50
-
51
-
52
-
53
-
54
-
55
-
56
-
57
-
58
-
59
-
60
-
61
-
62
-
63
-
64
-
65
-
66
-
67
-
68
-
69
-
70
-
71
-
72
-
73
-
74
-
75
-
76
-
77
-
78
-
79
-
80
-
81
-
82
-
83
-
84
-
85
-
86
-
87
-
88
-
89
-
90
-
91
-
92
-
93
-
94
-
95
-
96
-
97
-
98
-
99
-
100
-
101
-
102
-
103
-
104
-
105
-
106
-
107
-
108
-
109
-
110
-
111
-
112
-
113
-
114
-
115
-
116
-
117
-
118
-
119
-
120
-
121
-
122
-
123
-
124
-
125
-
126
-
127
-
128
-
129
-
130
-
131
-
132
-
133
-
134
-
135
-
136
-
137
-
138
-
 139
139 -
 140
140 -
 141
141 -
 142
142 -
 143
143 -
 144
144 -
 145
145 -
 146
146 -
 147
147 -
 148
148 -
 149
149 -
 150
150 -
 151
151 -
 152
152 -
 153
153 -
 154
154 -
 155
155 -
 156
156 -
 157
157 -
 158
158 -
 159
159 -
160
-
161
-
162
-
163
-
164
-
165
-
166
-
167
-
168
-
169
-
170
-
171
-
172
-
173
-
174
-
175
-
176
-
177
-
178
-
179
-
180
-
181
-
182
-
183
-
184
-
185
-
186
-
187
-
188
-
189
-
190
-
191
-
192
-
193
-
194
-
195
-
196
-
197
-
198
-
199
-
200
-
201
-
202
-
203
-
204
-
205
-
206
-
207
-
208
-
209
-
210
-
211
-
212
-
213
-
214
-
215
-
216
-
217
-
218
-
219
-
220
-
221
-
222
-
223
-
224
-
225
-
226
-
227
-
228
 |
 |

129
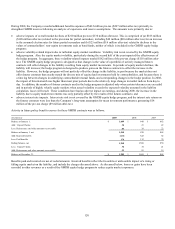
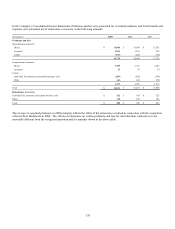
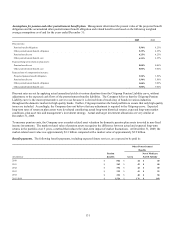
Plan assets. The target investment allocation percentages (58% equity securities, 20% fixed income, 7% real estate and 15% other)
are developed by management as guidelines, although the fair values of each asset category are expected to vary as a result of changes
in market conditions. The pension plan asset portfolio has been most heavily weighted towards equity securities, consisting of
domestic and international investments, in an effort to synchronize the expected higher rate of return on equities over the long-term
with the overall long-term nature of the pension benefit obligations. The diversification of the pension plan assets into other
investments is intended to mitigate the volatility in returns, while also providing adequate liquidity to fund benefit distributions.
As of December 31, 2009, pension plan assets included $2.6 billion invested in the separate accounts of Connecticut General Life
Insurance Company (“CGLIC”) and Life Insurance Company of North America, which are subsidiaries of the Company, as well as an
additional $0.3 billion invested directly in funds offered by the buyer of the retirement benefits business.
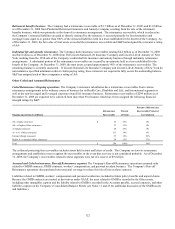
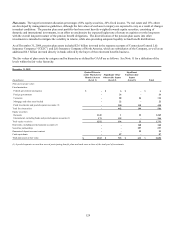
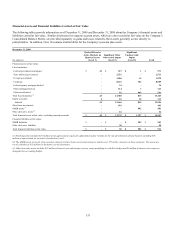
The fair values of plan assets by category and by hierarchy as defined by GAAP are as follows. See Note 11 for a definition of the
levels within the fair value hierarchy.
December 31, 2009
(In millions)
Quoted Prices in
Active Markets for
Identical Assets
(Level 1)
Significant Other
Observable Inputs
(Level 2)
Significant
Unobservable
Inputs
(Level 3) Total
Plan assets at fair value:
Fixed maturities:
Federal government and agency $ - $ 6 $ - $ 6
Foreign government - 26 - 26
Corporate - 88 26 114
Mortgage and other asset-backed - 22 - 22
Fund investments and pooled separate accounts (1) - 300 118 418
Total fixed maturities - 442 144 586
Equity securities:
Domestic 1,341 1 23 1,365
International, including funds and pooled separate accounts (1) 171 195 - 366
Total equity securities 1,512 196 23 1,731
Real estate, including pooled separate accounts (1) - - 160 160
Securities partnerships - - 257 257
Guaranteed deposit account contract - - 29 29
Cash equivalents - 87 - 87
Total plan assets at fair value $ 1,512 $ 725 $ 613 $ 2,850
(1) A pooled separate account has several participating benefit plans and each owns a share of the total pool of investments.