Cigna 2009 Annual Report Download - page 199
Download and view the complete annual report
Please find page 199 of the 2009 Cigna annual report below. You can navigate through the pages in the report by either clicking on the pages listed below, or by using the keyword search tool below to find specific information within the annual report.-
 1
1 -
2
-
3
-
4
-
5
-
6
-
7
-
8
-
9
-
10
-
11
-
12
-
13
-
14
-
15
-
16
-
17
-
18
-
19
-
20
-
21
-
22
-
23
-
24
-
25
-
26
-
27
-
28
-
29
-
30
-
31
-
32
-
33
-
34
-
35
-
36
-
37
-
38
-
39
-
40
-
41
-
42
-
43
-
44
-
45
-
46
-
47
-
48
-
49
-
50
-
51
-
52
-
53
-
54
-
55
-
56
-
57
-
58
-
59
-
60
-
61
-
62
-
63
-
64
-
65
-
66
-
67
-
68
-
69
-
70
-
71
-
72
-
73
-
74
-
75
-
76
-
77
-
78
-
79
-
80
-
81
-
82
-
83
-
84
-
85
-
86
-
87
-
88
-
89
-
90
-
91
-
92
-
93
-
94
-
95
-
96
-
97
-
98
-
99
-
100
-
101
-
102
-
103
-
104
-
105
-
106
-
107
-
108
-
109
-
110
-
111
-
112
-
113
-
114
-
115
-
116
-
117
-
118
-
119
-
120
-
121
-
122
-
123
-
124
-
125
-
126
-
127
-
128
-
129
-
130
-
131
-
132
-
133
-
134
-
135
-
136
-
137
-
138
-
139
-
140
-
141
-
142
-
143
-
144
-
145
-
146
-
147
-
148
-
149
-
150
-
151
-
152
-
153
-
154
-
155
-
156
-
157
-
158
-
159
-
160
-
161
-
162
-
163
-
164
-
165
-
166
-
167
-
168
-
169
-
170
-
171
-
172
-
173
-
174
-
175
-
176
-
177
-
178
-
179
-
180
-
181
-
182
-
183
-
184
-
185
-
186
-
187
-
188
-
 189
189 -
 190
190 -
 191
191 -
 192
192 -
 193
193 -
 194
194 -
 195
195 -
 196
196 -
 197
197 -
 198
198 -
 199
199 -
 200
200 -
 201
201 -
 202
202 -
 203
203 -
 204
204 -
 205
205 -
 206
206 -
 207
207 -
 208
208 -
 209
209 -
210
-
211
-
212
-
213
-
214
-
215
-
216
-
217
-
218
-
219
-
220
-
221
-
222
-
223
-
224
-
225
-
226
-
227
-
228
 |
 |

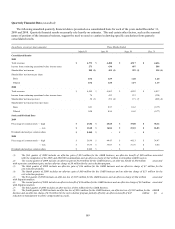
FS-3
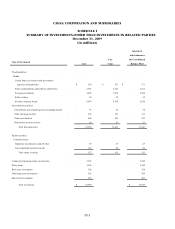
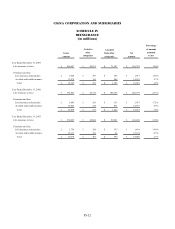
CIGNA CORPORATION AND SUBSIDIARIES
SCHEDULE I
SUMMARY OF INVESTMENTS-OTHER THAN INVESTMENTS IN RELATED PARTIES
December 31, 2009
(in millions)
Amount at
which shown in
Fair the Consolidated
Type of Investment Cost Value Balance Sheet
Fixed maturities:
Bonds:
United States government and government
agencies and authorities $ 398 $ 571 $ 571
States, municipalities and political subdivisions 2,341 2,521 2,521
Foreign governments 1,040 1,070 1,070
Public utilities 50 52 52
All other corporate bonds 8,074 8,510 8,510
Asset backed securities:
United States government agencies mortgage-backed 33 34 34
Other mortgage-backed 126 121 121
Other asset-backed 494 541 541
Redeemable preferred stocks 24 23 23
Total fixed maturities 12,580 13,443 13,443
Equity securities:
Common stocks:
Industrial, miscellaneous and all other 19 23 23
Non redeemable preferred stocks 118 90 90
Total equity securities 137 113 113
Commercial mortgage loans on real estate 3,522 3,522
Policy loans 1,549 1,549
Real estate investments 124 124
Other long-term investments 545 595
Short-term investments 493 493
Total investments $ 18,950 S 19,839