Cigna 2009 Annual Report Download - page 164
Download and view the complete annual report
Please find page 164 of the 2009 Cigna annual report below. You can navigate through the pages in the report by either clicking on the pages listed below, or by using the keyword search tool below to find specific information within the annual report.-
 1
1 -
2
-
3
-
4
-
5
-
6
-
7
-
8
-
9
-
10
-
11
-
12
-
13
-
14
-
15
-
16
-
17
-
18
-
19
-
20
-
21
-
22
-
23
-
24
-
25
-
26
-
27
-
28
-
29
-
30
-
31
-
32
-
33
-
34
-
35
-
36
-
37
-
38
-
39
-
40
-
41
-
42
-
43
-
44
-
45
-
46
-
47
-
48
-
49
-
50
-
51
-
52
-
53
-
54
-
55
-
56
-
57
-
58
-
59
-
60
-
61
-
62
-
63
-
64
-
65
-
66
-
67
-
68
-
69
-
70
-
71
-
72
-
73
-
74
-
75
-
76
-
77
-
78
-
79
-
80
-
81
-
82
-
83
-
84
-
85
-
86
-
87
-
88
-
89
-
90
-
91
-
92
-
93
-
94
-
95
-
96
-
97
-
98
-
99
-
100
-
101
-
102
-
103
-
104
-
105
-
106
-
107
-
108
-
109
-
110
-
111
-
112
-
113
-
114
-
115
-
116
-
117
-
118
-
119
-
120
-
121
-
122
-
123
-
124
-
125
-
126
-
127
-
128
-
129
-
130
-
131
-
132
-
133
-
134
-
135
-
136
-
137
-
138
-
139
-
140
-
141
-
142
-
143
-
144
-
145
-
146
-
147
-
148
-
149
-
150
-
151
-
152
-
153
-
 154
154 -
 155
155 -
 156
156 -
 157
157 -
 158
158 -
 159
159 -
 160
160 -
 161
161 -
 162
162 -
 163
163 -
 164
164 -
 165
165 -
 166
166 -
 167
167 -
 168
168 -
 169
169 -
 170
170 -
 171
171 -
 172
172 -
 173
173 -
 174
174 -
175
-
176
-
177
-
178
-
179
-
180
-
181
-
182
-
183
-
184
-
185
-
186
-
187
-
188
-
189
-
190
-
191
-
192
-
193
-
194
-
195
-
196
-
197
-
198
-
199
-
200
-
201
-
202
-
203
-
204
-
205
-
206
-
207
-
208
-
209
-
210
-
211
-
212
-
213
-
214
-
215
-
216
-
217
-
218
-
219
-
220
-
221
-
222
-
223
-
224
-
225
-
226
-
227
-
228
 |
 |

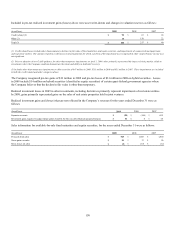
144
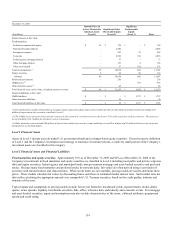
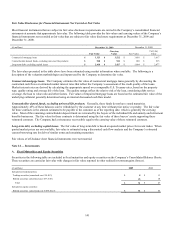
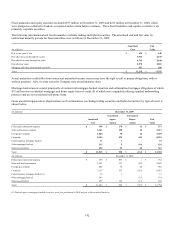
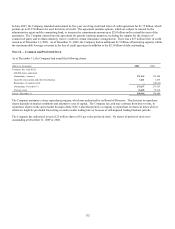
At December 31, commercial mortgage loans and real estate investments were distributed among the following property types and
geographic regions:
(In millions) 2009 2008
Property type
Office buildings $ 1,161 $ 1,118
Apartment buildings 901 988
Industrial 595 546
Hotels 499 512
Retail facilities 426 441
Other 64 65
Total $ 3,646 $ 3,670
Geographic region
Pacific $ 1,069 $ 1,102
South Atlantic 735 779
New England 582 546
Central 517 512
Middle Atlantic 408 394
Mountain 335 337
Total $ 3,646 $ 3,670
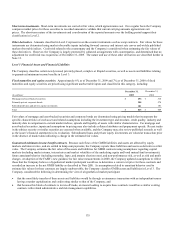
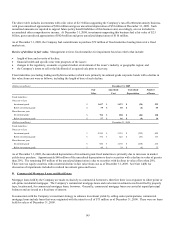
At December 31, 2009, scheduled commercial mortgage loan maturities were as follows (in millions): $278 in 2010, $394 in 2011,
$644 in 2012, $613 in 2013 and $1,593 thereafter.
Actual maturities could differ from contractual maturities for several reasons: borrowers may have the right to prepay obligations,
with or without prepayment penalties; the maturity date may be extended; and loans may be refinanced.
Real estate investments with a carrying value of $55 million at December 31, 2009 and $13 million at December 31, 2008 were non-
income producing during the preceding twelve months.
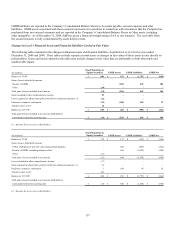
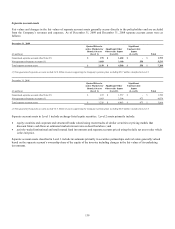
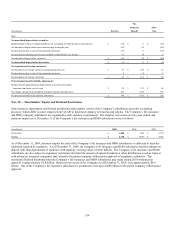
As of December 31, the Company had impaired commercial mortgage loans and related valuation reserves (excluding loans held for
sale) as follows:
(In millions) 2009 2008
Gross Reserves Net Gross Reserves Net
Impaired commercial mortgage loans with valuation reserves $ 143 $ (17) $ 126 $ - $ - $ -
Impaired commercial mortgage loans with no valuation reserves 96 - 96 59 - 59
Total $ 239 $ (17) $ 222 $ 59 $ - $ 59
During 2009, the Company recorded a $17 million pre-tax ($11 million after-tax) increase to valuation reserves on impaired
commercial mortgage loans. Commercial mortgage loans without valuation reserves are also considered impaired (probable that the
Company will not collect all amounts due according to the terms of the original loan agreements); however, the Company expects to
recover their remaining carrying value primarily because it is less than the fair value of the underlying collateral of these loans. The
average recorded investment in impaired mortgage loans was $116 million during December 31, 2009 and $12 million during
December 31, 2008. Pre-tax interest income recognized on impaired commercial mortgage loans was $3 million in 2009 and $1
million in 2008.
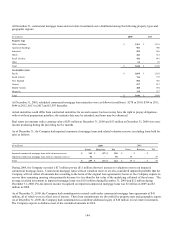
As of December 31, 2009, the Company had commitments to extend credit under commercial mortgage loan agreements of $41
million, all of which were at a fixed rate of interest. These loan commitments are diversified by property type and geographic region.
As of December 31, 2009, the Company had commitments to contribute additional equity of $10 million to real estate investments.
The Company expects to disburse most of the committed amounts in 2010.