Cigna 2009 Annual Report Download - page 153
Download and view the complete annual report
Please find page 153 of the 2009 Cigna annual report below. You can navigate through the pages in the report by either clicking on the pages listed below, or by using the keyword search tool below to find specific information within the annual report.-
 1
1 -
2
-
3
-
4
-
5
-
6
-
7
-
8
-
9
-
10
-
11
-
12
-
13
-
14
-
15
-
16
-
17
-
18
-
19
-
20
-
21
-
22
-
23
-
24
-
25
-
26
-
27
-
28
-
29
-
30
-
31
-
32
-
33
-
34
-
35
-
36
-
37
-
38
-
39
-
40
-
41
-
42
-
43
-
44
-
45
-
46
-
47
-
48
-
49
-
50
-
51
-
52
-
53
-
54
-
55
-
56
-
57
-
58
-
59
-
60
-
61
-
62
-
63
-
64
-
65
-
66
-
67
-
68
-
69
-
70
-
71
-
72
-
73
-
74
-
75
-
76
-
77
-
78
-
79
-
80
-
81
-
82
-
83
-
84
-
85
-
86
-
87
-
88
-
89
-
90
-
91
-
92
-
93
-
94
-
95
-
96
-
97
-
98
-
99
-
100
-
101
-
102
-
103
-
104
-
105
-
106
-
107
-
108
-
109
-
110
-
111
-
112
-
113
-
114
-
115
-
116
-
117
-
118
-
119
-
120
-
121
-
122
-
123
-
124
-
125
-
126
-
127
-
128
-
129
-
130
-
131
-
132
-
133
-
134
-
135
-
136
-
137
-
138
-
139
-
140
-
141
-
142
-
 143
143 -
 144
144 -
 145
145 -
 146
146 -
 147
147 -
 148
148 -
 149
149 -
 150
150 -
 151
151 -
 152
152 -
 153
153 -
 154
154 -
 155
155 -
 156
156 -
 157
157 -
 158
158 -
 159
159 -
 160
160 -
 161
161 -
 162
162 -
 163
163 -
164
-
165
-
166
-
167
-
168
-
169
-
170
-
171
-
172
-
173
-
174
-
175
-
176
-
177
-
178
-
179
-
180
-
181
-
182
-
183
-
184
-
185
-
186
-
187
-
188
-
189
-
190
-
191
-
192
-
193
-
194
-
195
-
196
-
197
-
198
-
199
-
200
-
201
-
202
-
203
-
204
-
205
-
206
-
207
-
208
-
209
-
210
-
211
-
212
-
213
-
214
-
215
-
216
-
217
-
218
-
219
-
220
-
221
-
222
-
223
-
224
-
225
-
226
-
227
-
228
 |
 |

133
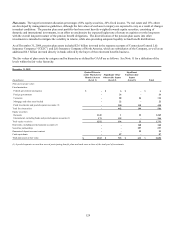
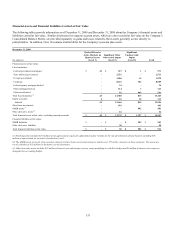
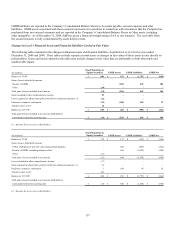
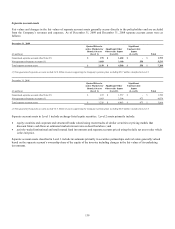
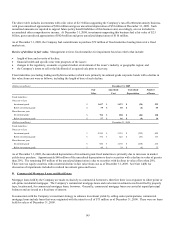
Financial Assets and Financial Liabilities Carried at Fair Value
The following tables provide information as of December 31, 2009 and December 31, 2008 about the Company’s financial assets and
liabilities carried at fair value. Similar disclosures for separate account assets, which are also recorded at fair value on the Company’s
Consolidated Balance Sheets, are provided separately as gains and losses related to these assets generally accrue directly to
policyholders. In addition, Note 10 contains similar tables for the Company’s pension plan assets.
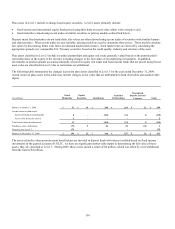
December 31, 2009
(In millions)
Quoted Prices in
Active Markets for
Identical Assets
(Level 1)
Significant Other
Observable Inputs
(Level 2)
Significant
Unobservable
Inputs
(Level 3) Total
Financial assets at fair value:
Fixed maturities:
Federal government and agency $ 43 $ 527 $ 1 $ 571
State and local government - 2,521 - 2,521
Foreign government - 1,056 14 1,070
Corporate - 8,241 344 8,585
Federal agency mortgage-backed - 34 - 34
Other mortgage-backed - 114 7 121
Other asset-backed - 92 449 541
Total fixed maturities (1) 43 12,585 815 13,443
Equity securities 2 81 30 113
Subtotal 45 12,666 845 13,556
Short-term investments - 493 - 493
GMIB assets (2) - - 482 482
Other derivative assets (3) - 16 - 16
Total financial assets at fair value, excluding separate accounts $ 45 $ 13,175 $ 1,327 $ 14,547
Financial liabilities at fair value:
GMIB liabilities $ - $ - $ 903 $ 903
Other derivative liabilities - 30 - 30
Total financial liabilities at fair value $ - $ 30 $ 903 $ 933
(1) Fixed maturities includes $274 million of net appreciation required to adjust future policy benefits for the run-off settlement annuity business including $38
million of appreciation for securities classified in Level 3.
(2) The GMIB assets represent retrocessional contracts in place from two external reinsurers which cover 55% of the exposures on these contracts. The assets are
net of a liability of $15 million for the future cost of reinsurance.
(3) Other derivative assets includes $12 million of interest rate and foreign currency swaps qualifying as cash flow hedges and $4 million of interest rate swaps not
designated as accounting hedges.