Cigna 2009 Annual Report Download - page 158
Download and view the complete annual report
Please find page 158 of the 2009 Cigna annual report below. You can navigate through the pages in the report by either clicking on the pages listed below, or by using the keyword search tool below to find specific information within the annual report.-
 1
1 -
2
-
3
-
4
-
5
-
6
-
7
-
8
-
9
-
10
-
11
-
12
-
13
-
14
-
15
-
16
-
17
-
18
-
19
-
20
-
21
-
22
-
23
-
24
-
25
-
26
-
27
-
28
-
29
-
30
-
31
-
32
-
33
-
34
-
35
-
36
-
37
-
38
-
39
-
40
-
41
-
42
-
43
-
44
-
45
-
46
-
47
-
48
-
49
-
50
-
51
-
52
-
53
-
54
-
55
-
56
-
57
-
58
-
59
-
60
-
61
-
62
-
63
-
64
-
65
-
66
-
67
-
68
-
69
-
70
-
71
-
72
-
73
-
74
-
75
-
76
-
77
-
78
-
79
-
80
-
81
-
82
-
83
-
84
-
85
-
86
-
87
-
88
-
89
-
90
-
91
-
92
-
93
-
94
-
95
-
96
-
97
-
98
-
99
-
100
-
101
-
102
-
103
-
104
-
105
-
106
-
107
-
108
-
109
-
110
-
111
-
112
-
113
-
114
-
115
-
116
-
117
-
118
-
119
-
120
-
121
-
122
-
123
-
124
-
125
-
126
-
127
-
128
-
129
-
130
-
131
-
132
-
133
-
134
-
135
-
136
-
137
-
138
-
139
-
140
-
141
-
142
-
143
-
144
-
145
-
146
-
147
-
 148
148 -
 149
149 -
 150
150 -
 151
151 -
 152
152 -
 153
153 -
 154
154 -
 155
155 -
 156
156 -
 157
157 -
 158
158 -
 159
159 -
 160
160 -
 161
161 -
 162
162 -
 163
163 -
 164
164 -
 165
165 -
 166
166 -
 167
167 -
 168
168 -
169
-
170
-
171
-
172
-
173
-
174
-
175
-
176
-
177
-
178
-
179
-
180
-
181
-
182
-
183
-
184
-
185
-
186
-
187
-
188
-
189
-
190
-
191
-
192
-
193
-
194
-
195
-
196
-
197
-
198
-
199
-
200
-
201
-
202
-
203
-
204
-
205
-
206
-
207
-
208
-
209
-
210
-
211
-
212
-
213
-
214
-
215
-
216
-
217
-
218
-
219
-
220
-
221
-
222
-
223
-
224
-
225
-
226
-
227
-
228
 |
 |
138
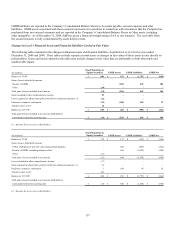
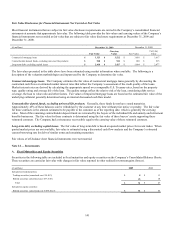
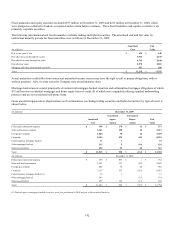
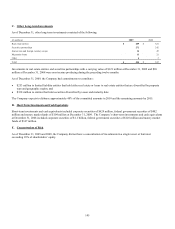
As noted in the table above, total gains and losses included in net income are reflected in the following captions in the Consolidated
Statements of Income:
x Realized investment gains (losses) and net investment income for amounts related to fixed maturities and equity securities; and
x Guaranteed minimum income benefits expense for amounts related to GMIB assets and liabilities.
Reclassifications impacting Level 3 financial instruments are reported as transfers in or out of the Level 3 category as of the beginning
of the quarter in which the transfer occurs. Therefore gains and losses in income only reflect activity for the period the instrument was
classified in Level 3. Typically, investments that transfer out of Level 3 are classified in Level 2 as market data on the securities
becomes more readily available.
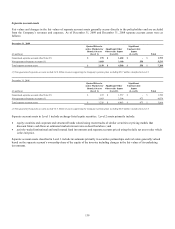
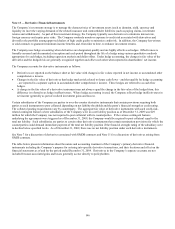
The Company provided reinsurance for other insurance companies that offer a guaranteed minimum income benefit, and then
retroceded a portion of the risk to other insurance companies. These arrangements with third-party insurers are the instruments still
held at the reporting date for GMIB assets and liabilities in the table above. Because these reinsurance arrangements remain in effect
at the reporting date, the Company has reflected the total gain or loss for the period as the total gain or loss included in income
attributable to instruments still held at the reporting date. However, the Company reduces the GMIB assets and liabilities resulting
from these reinsurance arrangements when annuitants lapse, die, elect their benefit, or reach the age after which the right to elect their
benefit expires.
Under FASB’s guidance for fair value measurements, the Company’s GMIB assets and liabilities are expected to be volatile in future
periods because the underlying capital markets assumptions will be based largely on market-observable inputs at the close of each
reporting period including interest rates and market-implied volatilities.
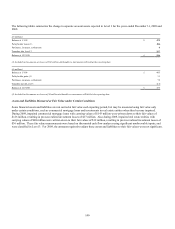
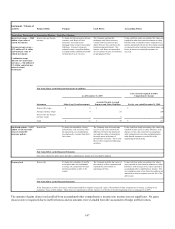
For 2009, the net pre-tax gain for GMIB was $304 million, and was primarily due to the following factors:
x increases in interest rates ($248 million);
x increases in underlying account values in the period, driven by favorable equity market and bond fund returns, resulting in
reduced exposures ($98 million);
x specific adjustments to nonperformance risk for the Company net of nonperformance risk of its reinsurers ($16 million); and
x updates to the risk and profit charge estimates ($30 million).
These favorable effects were partially offset by:
x higher than expected claim experience ($26 million);
x increases to the annuitization assumption, reflecting higher utilization experience ($21 million);
x updates to the lapse assumption ($14 million);
x updates to fund correlation assumptions ($4 million); and
x other amounts, including experience varying from assumptions, model and in-force updates ($23 million).
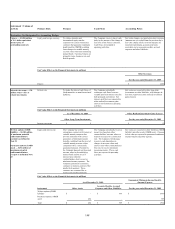
Excluding the net increase for the effect of adoption of FASB’s guidance for fair value measurement, the increase in the net GMIB
liability for 2008 was primarily driven by the impact of declines in underlying account values in the period, driven by declines in
equity markets and bond fund returns, resulting in increased exposures and decreases in interest rates since December 31, 2007.