Cigna 2009 Annual Report Download - page 178
Download and view the complete annual report
Please find page 178 of the 2009 Cigna annual report below. You can navigate through the pages in the report by either clicking on the pages listed below, or by using the keyword search tool below to find specific information within the annual report.-
 1
1 -
2
-
3
-
4
-
5
-
6
-
7
-
8
-
9
-
10
-
11
-
12
-
13
-
14
-
15
-
16
-
17
-
18
-
19
-
20
-
21
-
22
-
23
-
24
-
25
-
26
-
27
-
28
-
29
-
30
-
31
-
32
-
33
-
34
-
35
-
36
-
37
-
38
-
39
-
40
-
41
-
42
-
43
-
44
-
45
-
46
-
47
-
48
-
49
-
50
-
51
-
52
-
53
-
54
-
55
-
56
-
57
-
58
-
59
-
60
-
61
-
62
-
63
-
64
-
65
-
66
-
67
-
68
-
69
-
70
-
71
-
72
-
73
-
74
-
75
-
76
-
77
-
78
-
79
-
80
-
81
-
82
-
83
-
84
-
85
-
86
-
87
-
88
-
89
-
90
-
91
-
92
-
93
-
94
-
95
-
96
-
97
-
98
-
99
-
100
-
101
-
102
-
103
-
104
-
105
-
106
-
107
-
108
-
109
-
110
-
111
-
112
-
113
-
114
-
115
-
116
-
117
-
118
-
119
-
120
-
121
-
122
-
123
-
124
-
125
-
126
-
127
-
128
-
129
-
130
-
131
-
132
-
133
-
134
-
135
-
136
-
137
-
138
-
139
-
140
-
141
-
142
-
143
-
144
-
145
-
146
-
147
-
148
-
149
-
150
-
151
-
152
-
153
-
154
-
155
-
156
-
157
-
158
-
159
-
160
-
161
-
162
-
163
-
164
-
165
-
166
-
167
-
 168
168 -
 169
169 -
 170
170 -
 171
171 -
 172
172 -
 173
173 -
 174
174 -
 175
175 -
 176
176 -
 177
177 -
 178
178 -
 179
179 -
 180
180 -
 181
181 -
 182
182 -
 183
183 -
 184
184 -
 185
185 -
 186
186 -
 187
187 -
 188
188 -
189
-
190
-
191
-
192
-
193
-
194
-
195
-
196
-
197
-
198
-
199
-
200
-
201
-
202
-
203
-
204
-
205
-
206
-
207
-
208
-
209
-
210
-
211
-
212
-
213
-
214
-
215
-
216
-
217
-
218
-
219
-
220
-
221
-
222
-
223
-
224
-
225
-
226
-
227
-
228
 |
 |

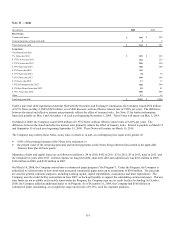
158
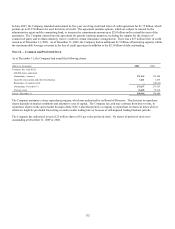
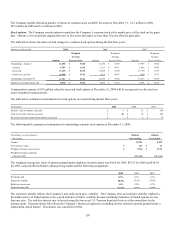
The Company had the following number of shares of common stock available for award at December 31: 23.3 million in 2009,
28.5 million in 2008 and 31.1 million in 2007.
Stock options. The Company awards options to purchase the Company’s common stock at the market price of the stock on the grant
date. Options vest over periods ranging from one to five years and expire no later than 10 years after the grant date.
The table below shows the status of, and changes in, common stock options during the last three years:
(Options in thousands) 2009 2008 2007
Weighted Weighted Weighted
Average Average Average
Options Exercise Price Options Exercise Price Options Exercise Price
Outstanding - January 1 12,258 $ 35.48 11,430 $32.69 17,955 $ 29.24
Granted 4,709 $ 14.15 2,311 $46.53 1,662 $ 46.97
Exercised (1,167) $ 25.32 (1,058) $27.40 (7,757) $ 27.67
Expired or canceled (2,049) $ 33.42 (425) $40.67 (430) $ 34.73
Outstanding - December 31 13,751 $ 29.34 12,258 $35.48 11,430 $ 32.69
Options exercisable at year-end 8,578 $ 33.53 8,687 $31.19 8,383 $ 29.37
Compensation expense of $19 million related to unvested stock options at December 31, 2009 will be recognized over the next two
years (weighted average period).
The table below summarizes information for stock options exercised during the last three years:
(In millions) 2009 2008 2007
Intrinsic value of options exercised $ 7 $ 23 $ 169
Cash received for options exercised $ 30 $ 26 $ 203
Excess tax benefits realized from options exercised $ - $ 6 $ 39
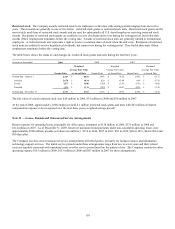
The following table summarizes information for outstanding common stock options at December 31, 2009:
(In millions, except options in Options Options
thousands) Outstanding Exercisable
Number 13,751 8,578
Total intrinsic value $ 123 $ 41
Weighted average exercise price $ 29.34 $ 33.53
Weighted average remaining
contractual life 6.0 years 4.3 years
The weighted average fair value of options granted under employee incentive plans was $4.60 for 2009, $14.33 for 2008 and $16.05
for 2007, using the Black-Scholes option-pricing model and the following assumptions:
2009 2008 2007
Dividend yield 0.3% 0.1% 0.1%
Expected volatility 40.0% 35.0% 35.0%
Risk-free interest rate 1.6% 2.2% 4.7%
Expected option life 4 years 4 years 4 years
The expected volatility reflects the Company’s past daily stock price volatility. The Company does not consider volatility implied in
the market prices of traded options to be a good indicator of future volatility because remaining maturities of traded options are less
than one year. The risk-free interest rate is derived using the four-year U.S. Treasury bond yield rate as of the award date for the
primary grant. Expected option life reflects the Company’s historical experience excluding activity related to options granted under a
replacement option feature. This feature was cancelled in 2004.