Cigna 2009 Annual Report Download - page 122
Download and view the complete annual report
Please find page 122 of the 2009 Cigna annual report below. You can navigate through the pages in the report by either clicking on the pages listed below, or by using the keyword search tool below to find specific information within the annual report.-
 1
1 -
2
-
3
-
4
-
5
-
6
-
7
-
8
-
9
-
10
-
11
-
12
-
13
-
14
-
15
-
16
-
17
-
18
-
19
-
20
-
21
-
22
-
23
-
24
-
25
-
26
-
27
-
28
-
29
-
30
-
31
-
32
-
33
-
34
-
35
-
36
-
37
-
38
-
39
-
40
-
41
-
42
-
43
-
44
-
45
-
46
-
47
-
48
-
49
-
50
-
51
-
52
-
53
-
54
-
55
-
56
-
57
-
58
-
59
-
60
-
61
-
62
-
63
-
64
-
65
-
66
-
67
-
68
-
69
-
70
-
71
-
72
-
73
-
74
-
75
-
76
-
77
-
78
-
79
-
80
-
81
-
82
-
83
-
84
-
85
-
86
-
87
-
88
-
89
-
90
-
91
-
92
-
93
-
94
-
95
-
96
-
97
-
98
-
99
-
100
-
101
-
102
-
103
-
104
-
105
-
106
-
107
-
108
-
109
-
110
-
111
-
 112
112 -
 113
113 -
 114
114 -
 115
115 -
 116
116 -
 117
117 -
 118
118 -
 119
119 -
 120
120 -
 121
121 -
 122
122 -
 123
123 -
 124
124 -
 125
125 -
 126
126 -
 127
127 -
 128
128 -
 129
129 -
 130
130 -
 131
131 -
 132
132 -
133
-
134
-
135
-
136
-
137
-
138
-
139
-
140
-
141
-
142
-
143
-
144
-
145
-
146
-
147
-
148
-
149
-
150
-
151
-
152
-
153
-
154
-
155
-
156
-
157
-
158
-
159
-
160
-
161
-
162
-
163
-
164
-
165
-
166
-
167
-
168
-
169
-
170
-
171
-
172
-
173
-
174
-
175
-
176
-
177
-
178
-
179
-
180
-
181
-
182
-
183
-
184
-
185
-
186
-
187
-
188
-
189
-
190
-
191
-
192
-
193
-
194
-
195
-
196
-
197
-
198
-
199
-
200
-
201
-
202
-
203
-
204
-
205
-
206
-
207
-
208
-
209
-
210
-
211
-
212
-
213
-
214
-
215
-
216
-
217
-
218
-
219
-
220
-
221
-
222
-
223
-
224
-
225
-
226
-
227
-
228
 |
 |

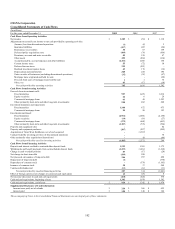
102
CIGNA Corporation
Consolidated Statements of Cash Flows
(In millions)
For the years ended December 31, 2009 2008 2007
Cash Flows from Operating Activities
Net income $ 1,305 $ 294 $ 1,118
Adjustments to reconcile net income to net cash provided by operating activities:
(Income) loss from discontinued operations (1) (4) 5
Insurance liabilities (357) 485 (24)
Reinsurance recoverables 30 63 159
Deferred policy acquisition costs (109) (74) (106)
Premiums, accounts and notes receivable 49 219 47
Other assets 452 (860) (134)
Accounts payable, accrued expenses and other liabilities (1,321) 1,466 150
Current income taxes 55 (72) 10
Deferred income taxes 319 (221) -
Realized investment (gains) losses 43 170 (16)
Depreciation and amortization 268 244 194
Gains on sales of businesses (excluding discontinued operations) (32) (38) (47)
Mortgage loans originated and held for sale - - (80)
Proceeds from sales of mortgage loans held for sale 1 1 76
Other, net 43 (17) (10)
Net cash provided by operating activities 745 1,656 1,342
Cash Flows from Investing Activities
Proceeds from investments sold:
Fixed maturities 927 1,459 1,012
Equity securities 22 6 28
Commercial mortgage loans 61 48 1,293
Other (primarily short-term and other long-term investments) 910 492 260
Investment maturities and repayments:
Fixed maturities 1,100 872 973
Commercial mortgage loans 94 98 123
Investments purchased:
Fixed maturities (2,916) (2,681) (2,150)
Equity securities (14) (18) (27)
Commercial mortgage loans (175) (488) (693)
Other (primarily short-term and other long-term investments) (1,187) (776) (394)
Property and equipment sales - - 82
Property and equipment purchases (307) (257) (262)
Acquisition of Great-West Healthcare, net of cash acquired - (1,319) -
Cash provided by investing activities of discontinued operations - - 70
Other (primarily other acquisitions/dispositions) - (8) (46)
Net cash provided by (used in) investing activities (1,485) (2,572) 269
Cash Flows from Financing Activities
Deposits and interest credited to contractholder deposit funds 1,312 1,305 1,175
Withdrawals and benefit payments from contractholder deposit funds (1,223) (1,214) (1,368)
Change in cash overdraft position 53 (17) (20)
Net change in short-term debt (199) 298 -
Net proceeds on issuance of long-term debt 346 297 498
Repayment of long-term debt (1) - (378)
Repurchase of common stock - (378) (1,185)
Issuance of common stock 30 37 248
Common dividends paid (11) (14) (11)
Net cash provided by (used in) financing activities 307 314 (1,041)
Effect of foreign currency rate changes on cash and cash equivalents 15 (26) 8
Net increase (decrease) in cash and cash equivalents (418) (628) 578
Cash and cash equivalents, beginning of year 1,342 1,970 1,392
Cash and cash equivalents, end of year $ 924 $ 1,342 $ 1,970
Supplemental Disclosure of Cash Information:
Income taxes paid, net of refunds $ 220 $ 366 $ 455
Interest paid $ 158 $ 140 $ 122
The accompanying Notes to the Consolidated Financial Statements are an integral part of these statements.