Cigna 2009 Annual Report Download - page 121
Download and view the complete annual report
Please find page 121 of the 2009 Cigna annual report below. You can navigate through the pages in the report by either clicking on the pages listed below, or by using the keyword search tool below to find specific information within the annual report.-
 1
1 -
2
-
3
-
4
-
5
-
6
-
7
-
8
-
9
-
10
-
11
-
12
-
13
-
14
-
15
-
16
-
17
-
18
-
19
-
20
-
21
-
22
-
23
-
24
-
25
-
26
-
27
-
28
-
29
-
30
-
31
-
32
-
33
-
34
-
35
-
36
-
37
-
38
-
39
-
40
-
41
-
42
-
43
-
44
-
45
-
46
-
47
-
48
-
49
-
50
-
51
-
52
-
53
-
54
-
55
-
56
-
57
-
58
-
59
-
60
-
61
-
62
-
63
-
64
-
65
-
66
-
67
-
68
-
69
-
70
-
71
-
72
-
73
-
74
-
75
-
76
-
77
-
78
-
79
-
80
-
81
-
82
-
83
-
84
-
85
-
86
-
87
-
88
-
89
-
90
-
91
-
92
-
93
-
94
-
95
-
96
-
97
-
98
-
99
-
100
-
101
-
102
-
103
-
104
-
105
-
106
-
107
-
108
-
109
-
110
-
 111
111 -
 112
112 -
 113
113 -
 114
114 -
 115
115 -
 116
116 -
 117
117 -
 118
118 -
 119
119 -
 120
120 -
 121
121 -
 122
122 -
 123
123 -
 124
124 -
 125
125 -
 126
126 -
 127
127 -
 128
128 -
 129
129 -
 130
130 -
 131
131 -
132
-
133
-
134
-
135
-
136
-
137
-
138
-
139
-
140
-
141
-
142
-
143
-
144
-
145
-
146
-
147
-
148
-
149
-
150
-
151
-
152
-
153
-
154
-
155
-
156
-
157
-
158
-
159
-
160
-
161
-
162
-
163
-
164
-
165
-
166
-
167
-
168
-
169
-
170
-
171
-
172
-
173
-
174
-
175
-
176
-
177
-
178
-
179
-
180
-
181
-
182
-
183
-
184
-
185
-
186
-
187
-
188
-
189
-
190
-
191
-
192
-
193
-
194
-
195
-
196
-
197
-
198
-
199
-
200
-
201
-
202
-
203
-
204
-
205
-
206
-
207
-
208
-
209
-
210
-
211
-
212
-
213
-
214
-
215
-
216
-
217
-
218
-
219
-
220
-
221
-
222
-
223
-
224
-
225
-
226
-
227
-
228
 |
 |

101
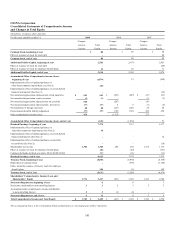
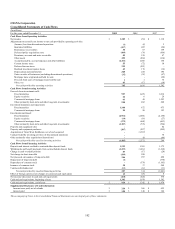
CIGNA Corporation
Consolidated Statements of Comprehensive Income
and Changes in Total Equity
(In millions, except per share amounts)
For the years ended December 31, 2009 2008 2007
Compre- Compre- Compre-
hensive Total hensive Total hensive Total
Income Equity Income Equity Income Equity
Common Stock, beginning of year $ 88 $ 88 $ 40
Effect of issuance of stock for stock split - - 48
Common Stock, end of year 88 88 88
Additional Paid-In Capital, beginning of year 2,502 2,474 2,451
Effect of issuance of stock for stock split - - (48)
Effect of issuance of stock for employee benefit plans 12 28 71
Additional Paid-In Capital, end of year 2,514 2,502 2,474
Accumulated Other Comprehensive Income (Loss),
beginning of year (1,074) 51 (169)
Implementation effect of updated guidance on
other-than-temporary impairments (see Note 2) (18) - -
Implementation effect of updated guidance on certain hybrid
financial instruments (See Note 2) - - (12)
Net unrealized appreciation (depreciation), fixed maturities $ 543 543 $ (287) (287) $ (47) (47)
Net unrealized depreciation, equity securities (3) (3) - - (3) (3)
Net unrealized appreciation (depreciation) on securities 540 (287) (50)
Net unrealized appreciation (depreciation), derivatives (17) (17) 6 6 (4) (4)
Net translation of foreign currencies 48 48 (121) (121) 28 28
Postretirement benefits liability adjustment (97) (97) (723) (723) 258 258
Other comprehensive income (loss) 474 (1,125) 232
Accumulated Other Comprehensive Income (Loss), end of year (618) (1,074) 51
Retained Earnings, beginning of year 7,374 7,113 6,177
Implementation effect of updated guidance on
other-than-temporary impairments (See Note 2) 18 - -
Implementation effect of updated guidance on certain hybrid
financial instruments (See Note 2) - - 12
Implementation effect of updated guidance on uncertain
tax positions (See Note 2) - - (29)
Shareholders' net income 1,302 1,302 292 292 1,115 1,115
Effect of issuance of stock for employee benefit plans (58) (20) (151)
Common dividends declared (per share: $0.04; $0.04; $0.04) (11) (11) (11)
Retained Earnings, end of year 8,625 7,374 7,113
Treasury Stock, beginning of year (5,298) (4,978) (4,169)
Repurchase of common stock - (378) (1,158)
Other, primarily issuance of treasury stock for employee
benefit plans 106 58 349
Treasury Stock, end of year (5,192) (5,298) (4,978)
Shareholders' Comprehensive Income (Loss) and
Shareholders’ Equity 1,776 5,417 (833) 3,592 1,347 4,748
Noncontrolling interest, beginning of year 6 6 3
Net income attributable to noncontrolling interest 3 3 2 2 3 3
Accumulated other comprehensive income attributable
to noncontrolling interest 3 3 (2) (2) - -
Noncontrolling interest, end of year 6 12 - 6 3 6
Total Comprehensive Income and Total Equity $ 1,782 $ 5,429 $ (833) $ 3,598 $ 1,350 $ 4,754
The accompanying Notes to the Consolidated Financial Statements are an integral part of these statements.