Cigna 2009 Annual Report Download - page 111
Download and view the complete annual report
Please find page 111 of the 2009 Cigna annual report below. You can navigate through the pages in the report by either clicking on the pages listed below, or by using the keyword search tool below to find specific information within the annual report.-
 1
1 -
2
-
3
-
4
-
5
-
6
-
7
-
8
-
9
-
10
-
11
-
12
-
13
-
14
-
15
-
16
-
17
-
18
-
19
-
20
-
21
-
22
-
23
-
24
-
25
-
26
-
27
-
28
-
29
-
30
-
31
-
32
-
33
-
34
-
35
-
36
-
37
-
38
-
39
-
40
-
41
-
42
-
43
-
44
-
45
-
46
-
47
-
48
-
49
-
50
-
51
-
52
-
53
-
54
-
55
-
56
-
57
-
58
-
59
-
60
-
61
-
62
-
63
-
64
-
65
-
66
-
67
-
68
-
69
-
70
-
71
-
72
-
73
-
74
-
75
-
76
-
77
-
78
-
79
-
80
-
81
-
82
-
83
-
84
-
85
-
86
-
87
-
88
-
89
-
90
-
91
-
92
-
93
-
94
-
95
-
96
-
97
-
98
-
99
-
100
-
 101
101 -
 102
102 -
 103
103 -
 104
104 -
 105
105 -
 106
106 -
 107
107 -
 108
108 -
 109
109 -
 110
110 -
 111
111 -
 112
112 -
 113
113 -
 114
114 -
 115
115 -
 116
116 -
 117
117 -
 118
118 -
 119
119 -
 120
120 -
 121
121 -
122
-
123
-
124
-
125
-
126
-
127
-
128
-
129
-
130
-
131
-
132
-
133
-
134
-
135
-
136
-
137
-
138
-
139
-
140
-
141
-
142
-
143
-
144
-
145
-
146
-
147
-
148
-
149
-
150
-
151
-
152
-
153
-
154
-
155
-
156
-
157
-
158
-
159
-
160
-
161
-
162
-
163
-
164
-
165
-
166
-
167
-
168
-
169
-
170
-
171
-
172
-
173
-
174
-
175
-
176
-
177
-
178
-
179
-
180
-
181
-
182
-
183
-
184
-
185
-
186
-
187
-
188
-
189
-
190
-
191
-
192
-
193
-
194
-
195
-
196
-
197
-
198
-
199
-
200
-
201
-
202
-
203
-
204
-
205
-
206
-
207
-
208
-
209
-
210
-
211
-
212
-
213
-
214
-
215
-
216
-
217
-
218
-
219
-
220
-
221
-
222
-
223
-
224
-
225
-
226
-
227
-
228
 |
 |

91
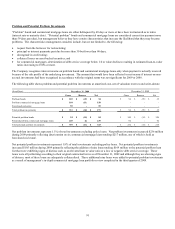
Problem and Potential Problem Investments
“Problem” bonds and commercial mortgage loans are either delinquent by 60 days or more or have been restructured as to terms
(interest rate or maturity date). “Potential problem” bonds and commercial mortgage loans are considered current (no payment more
than 59 days past due), but management believes they have certain characteristics that increase the likelihood that they may become
problems. The characteristics management considers include, but are not limited to, the following:
x request from the borrower for restructuring;
x principal or interest payments past due by more than 30 but fewer than 60 days;
x downgrade in credit rating;
x collateral losses on asset-backed securities; and
x for commercial mortgages, deterioration of debt service coverage below 1.0 or value declines resulting in estimated loan-to-value
ratios increasing to 100% or more.
The Company recognizes interest income on problem bonds and commercial mortgage loans only when payment is actually received
because of the risk profile of the underlying investment. The amount that would have been reflected in net income if interest on non-
accrual investments had been recognized in accordance with the original terms was not significant for 2009 or 2008.
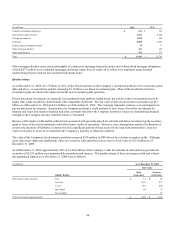
The following table shows problem and potential problem investments at amortized cost, net of valuation reserves and write-downs:
(In millions) December 31, 2009 December 31, 2008
Gross Reserve Net Gross Reserve Net
Problem bonds $ 103 $ (49) $ 54 $ 94 $ (59) $ 35
Problem commercial mortgage loans 169 (11) 158 - - -
Foreclosed real estate 59 - 59 - - -
Total problem investments $ 331 $ (60) $ 271 $ 94 $ (59) $ 35
Potential problem bonds $ 94 $ (10) $ 84 $ 140 $ (14) $ 126
Potential problem commercial mortgage loans 245 (6) 239 92 - 92
Total potential problem investments $ 339 $ (16) $ 323 $ 232 $ (14) $ 218
Net problem investments represent 1.5% of total investments excluding policy loans. Net problem investments increased $236 million
during 2009 primarily reflecting deterioration on six commercial mortgage loans totaling $217 million, one of which is held as
foreclosed real estate.
Net potential problem investments represent 1.8% of total investments excluding policy loans. Net potential problem investments
increased $105 million during 2009 primarily reflecting the addition of nine loans totaling $169 million to the potential problem loan
list that were exhibiting signs of distress such as an elevated loan to value ratio or a low or negative debt service coverage. These
loans were all performing according to their original contractual terms as of December 31, 2009 and although they are showing signs
of distress, most of these loans are adequately collateralized. These additional nine loans were added to potential problem investments
as a result of management’s in-depth commercial mortgage loan portfolio review completed in the third quarter of 2009.