Cigna 2009 Annual Report Download - page 170
Download and view the complete annual report
Please find page 170 of the 2009 Cigna annual report below. You can navigate through the pages in the report by either clicking on the pages listed below, or by using the keyword search tool below to find specific information within the annual report.-
 1
1 -
2
-
3
-
4
-
5
-
6
-
7
-
8
-
9
-
10
-
11
-
12
-
13
-
14
-
15
-
16
-
17
-
18
-
19
-
20
-
21
-
22
-
23
-
24
-
25
-
26
-
27
-
28
-
29
-
30
-
31
-
32
-
33
-
34
-
35
-
36
-
37
-
38
-
39
-
40
-
41
-
42
-
43
-
44
-
45
-
46
-
47
-
48
-
49
-
50
-
51
-
52
-
53
-
54
-
55
-
56
-
57
-
58
-
59
-
60
-
61
-
62
-
63
-
64
-
65
-
66
-
67
-
68
-
69
-
70
-
71
-
72
-
73
-
74
-
75
-
76
-
77
-
78
-
79
-
80
-
81
-
82
-
83
-
84
-
85
-
86
-
87
-
88
-
89
-
90
-
91
-
92
-
93
-
94
-
95
-
96
-
97
-
98
-
99
-
100
-
101
-
102
-
103
-
104
-
105
-
106
-
107
-
108
-
109
-
110
-
111
-
112
-
113
-
114
-
115
-
116
-
117
-
118
-
119
-
120
-
121
-
122
-
123
-
124
-
125
-
126
-
127
-
128
-
129
-
130
-
131
-
132
-
133
-
134
-
135
-
136
-
137
-
138
-
139
-
140
-
141
-
142
-
143
-
144
-
145
-
146
-
147
-
148
-
149
-
150
-
151
-
152
-
153
-
154
-
155
-
156
-
157
-
158
-
159
-
 160
160 -
 161
161 -
 162
162 -
 163
163 -
 164
164 -
 165
165 -
 166
166 -
 167
167 -
 168
168 -
 169
169 -
 170
170 -
 171
171 -
 172
172 -
 173
173 -
 174
174 -
 175
175 -
 176
176 -
 177
177 -
 178
178 -
 179
179 -
 180
180 -
181
-
182
-
183
-
184
-
185
-
186
-
187
-
188
-
189
-
190
-
191
-
192
-
193
-
194
-
195
-
196
-
197
-
198
-
199
-
200
-
201
-
202
-
203
-
204
-
205
-
206
-
207
-
208
-
209
-
210
-
211
-
212
-
213
-
214
-
215
-
216
-
217
-
218
-
219
-
220
-
221
-
222
-
223
-
224
-
225
-
226
-
227
-
228
 |
 |

150
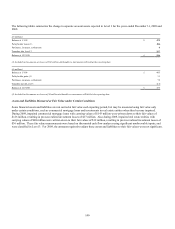
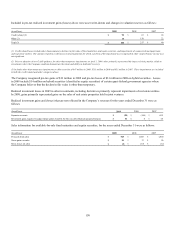
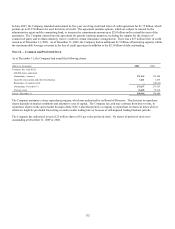
Included in pre-tax realized investment gains (losses) above were asset write-downs and changes in valuation reserves as follows:
(in millions) 2009 2008 2007
Credit related (1) $ 93 $ 67 $ 18
Other (2) 13 150 22
Total (3) $ 106 $ 217 $ 40
(1) Credit-related losses include other-than-temporary declines in fair value of fixed maturities and equity securities, and impairments of commercial mortgage loans
and real estate entities. The amount related to credit losses on fixed maturities for which a portion of the impairment was recognized in other comprehensive income was
not significant.
(2) Prior to adoption of new GAAP guidance for other-than-temporary impairments on April 1, 2009, other primarily represented the impact of rising market yields on
investments where the Company could not demonstrate the intent and ability to hold until recovery.
(3) Includes other-than-temporary impairments on debt securities of $47 million in 2009, $213 million in 2008 and $31 million in 2007. These impairments are included
in both the credit related and other categories above.
The Company recognized pre-tax gains of $13 million in 2009 and pre-tax losses of $31 million in 2008 on hybrid securities. Losses
in 2008 include $14 million on hybrid securities (classified as equity securities) of certain quasi-federal government agencies where
the Company believes that the decline in fair value is other than temporary.
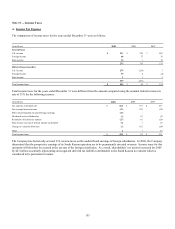
Realized investment losses in 2009 in other investments, including derivatives primarily represent impairments of real estate entities.
In 2008, gains primarily represented gains on the sales of real estate properties held in joint ventures.
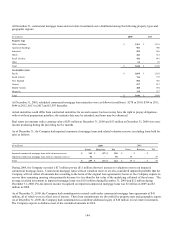
Realized investment gains and (losses) that are not reflected in the Company’s revenues for the years ended December 31 were as
follows:
(In millions) 2009 2008 2007
Separate accounts $ (25) $ (146) $ 652
Investment gains required to adjust future policy benefits for the run-off settlement annuity business $ 51 $ 8 $ 18
Sales information for available-for-sale fixed maturities and equity securities, for the years ended December 31 were as follows:
(In millions) 2009 2008 2007
Proceeds from sales $ 949 $ 1,465 $ 1,040
Gross gains on sales $ 51 $ 13 $ 26
Gross losses on sales $ (9) $(53) $(12)