Cigna 2009 Annual Report Download - page 100
Download and view the complete annual report
Please find page 100 of the 2009 Cigna annual report below. You can navigate through the pages in the report by either clicking on the pages listed below, or by using the keyword search tool below to find specific information within the annual report.-
 1
1 -
2
-
3
-
4
-
5
-
6
-
7
-
8
-
9
-
10
-
11
-
12
-
13
-
14
-
15
-
16
-
17
-
18
-
19
-
20
-
21
-
22
-
23
-
24
-
25
-
26
-
27
-
28
-
29
-
30
-
31
-
32
-
33
-
34
-
35
-
36
-
37
-
38
-
39
-
40
-
41
-
42
-
43
-
44
-
45
-
46
-
47
-
48
-
49
-
50
-
51
-
52
-
53
-
54
-
55
-
56
-
57
-
58
-
59
-
60
-
61
-
62
-
63
-
64
-
65
-
66
-
67
-
68
-
69
-
70
-
71
-
72
-
73
-
74
-
75
-
76
-
77
-
78
-
79
-
80
-
81
-
82
-
83
-
84
-
85
-
86
-
87
-
88
-
89
-
 90
90 -
 91
91 -
 92
92 -
 93
93 -
 94
94 -
 95
95 -
 96
96 -
 97
97 -
 98
98 -
 99
99 -
 100
100 -
 101
101 -
 102
102 -
 103
103 -
 104
104 -
 105
105 -
 106
106 -
 107
107 -
 108
108 -
 109
109 -
 110
110 -
111
-
112
-
113
-
114
-
115
-
116
-
117
-
118
-
119
-
120
-
121
-
122
-
123
-
124
-
125
-
126
-
127
-
128
-
129
-
130
-
131
-
132
-
133
-
134
-
135
-
136
-
137
-
138
-
139
-
140
-
141
-
142
-
143
-
144
-
145
-
146
-
147
-
148
-
149
-
150
-
151
-
152
-
153
-
154
-
155
-
156
-
157
-
158
-
159
-
160
-
161
-
162
-
163
-
164
-
165
-
166
-
167
-
168
-
169
-
170
-
171
-
172
-
173
-
174
-
175
-
176
-
177
-
178
-
179
-
180
-
181
-
182
-
183
-
184
-
185
-
186
-
187
-
188
-
189
-
190
-
191
-
192
-
193
-
194
-
195
-
196
-
197
-
198
-
199
-
200
-
201
-
202
-
203
-
204
-
205
-
206
-
207
-
208
-
209
-
210
-
211
-
212
-
213
-
214
-
215
-
216
-
217
-
218
-
219
-
220
-
221
-
222
-
223
-
224
-
225
-
226
-
227
-
228
 |
 |

80
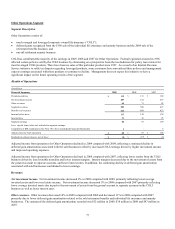
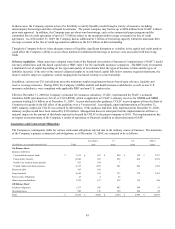
LIQUIDITY AND CAPITAL RESOURCES
(In millions)
Financial Summary 2009 2008 2007
Short-term investments $ 493 $ 236 $ 21
Cash and cash equivalents $ 924 $ 1,342 $ 1,970
Short-term debt $ 104 $ 301 $ 3
Long-term debt $ 2,436 $ 2,090 $ 1,790
Shareholders' equity $ 5,417 $ 3,592 $ 4,748
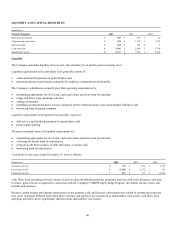
Liquidity
The Company maintains liquidity at two levels: the subsidiary level and the parent company level.
Liquidity requirements at the subsidiary level generally consist of:
x claim and benefit payments to policyholders; and
x operating expense requirements, primarily for employee compensation and benefits.
The Company’s subsidiaries normally meet their operating requirements by:
x maintaining appropriate levels of cash, cash equivalents and short-term investments;
x using cash flows from operating activities;
x selling investments;
x matching investment durations to those estimated for the related insurance and contractholder liabilities; and
x borrowing from its parent company.
Liquidity requirements at the parent level generally consist of:
x debt service and dividend payments to shareholders; and
x pension plan funding.
The parent normally meets its liquidity requirements by:
x maintaining appropriate levels of cash, cash equivalents and short-term investments;
x collecting dividends from its subsidiaries;
x using proceeds from issuance of debt and equity securities; and
x borrowing from its subsidiaries.
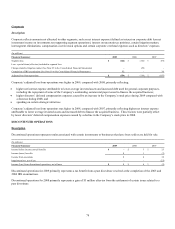
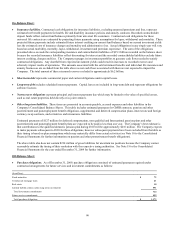
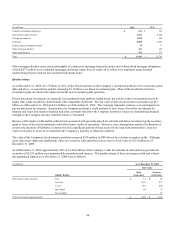
Cash flows for the years ended December 31, were as follows:
(In millions) 2009 2008 2007
Operating activities $ 745 $ 1,656 $ 1,342
Investing activities $(1,485) $ (2,572) $ 269
Financing activities $ 307 $ 314 $(1,041)
Cash flows from operating activities consist of cash receipts and disbursements for premiums and fees, mail order pharmacy and other
revenues, gains (losses) recognized in connection with the Company’s GMDB equity hedge program, investment income, taxes, and
benefits and expenses.
Because certain income and expense transactions do not generate cash, and because cash transactions related to revenue and expenses
may occur in periods different from when those revenues and expenses are recognized in shareholders’ net income, cash flows from
operating activities can be significantly different from shareholders’ net income.