Albertsons 2009 Annual Report Download - page 70
Download and view the complete annual report
Please find page 70 of the 2009 Albertsons annual report below. You can navigate through the pages in the report by either clicking on the pages listed below, or by using the keyword search tool below to find specific information within the annual report.-
 1
1 -
2
-
3
-
4
-
5
-
6
-
7
-
8
-
9
-
10
-
11
-
12
-
13
-
14
-
15
-
16
-
17
-
18
-
19
-
20
-
21
-
22
-
23
-
24
-
25
-
26
-
27
-
28
-
29
-
30
-
31
-
32
-
33
-
34
-
35
-
36
-
37
-
38
-
39
-
40
-
41
-
42
-
43
-
44
-
45
-
46
-
47
-
48
-
49
-
50
-
51
-
52
-
53
-
54
-
55
-
56
-
57
-
58
-
59
-
 60
60 -
 61
61 -
 62
62 -
 63
63 -
 64
64 -
 65
65 -
 66
66 -
 67
67 -
 68
68 -
 69
69 -
 70
70 -
 71
71 -
 72
72 -
 73
73 -
 74
74 -
 75
75 -
 76
76 -
 77
77 -
 78
78 -
 79
79 -
 80
80 -
81
-
82
-
83
-
84
-
85
-
86
-
87
-
88
-
89
-
90
-
91
-
92
-
93
-
94
-
95
-
96
-
97
-
98
-
99
-
100
-
101
-
102
-
103
-
104
 |
 |

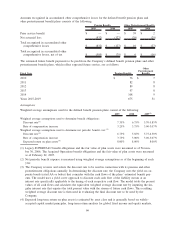
Amounts recognized in accumulated other comprehensive losses for the defined benefit pension plans and
other postretirement benefit plans consists of the following:
2009 2008 2009 2008
Pension Benefits Other Postretirement Benefits
Prior service benefit $ — $ — $ 39 $ 2
Net actuarial loss (832) (127) (29) (29)
Total recognized in accumulated other
comprehensive losses $ (832) $ (127) $ 10 $ (27)
Total recognized in accumulated other
comprehensive losses, net of tax $ (509) $ (79) $ 6 $ (16)
The estimated future benefit payments to be paid from the Company’s defined benefit pension plans and other
postretirement benefit plans, which reflect expected future service, are as follows:
Fiscal Year Pension Benefits
Other
Postretirement
Benefits
2010 $ 76 $ 7
2011 82 8
2012 89 8
2013 97 8
2014 108 9
Years 2015-2019 675 51
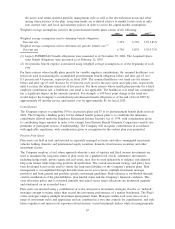
Assumptions
Weighted average assumptions used for the defined benefit pension plans consist of the following:
2009 2008 2007
(1)
Weighted average assumptions used to determine benefit obligations:
Discount rate
(3)
7.35% 6.75% 5.70-5.85%
Rate of compensation increase 3.25% 3.75% 3.00-3.07%
Weighted average assumptions used to determine net periodic benefit cost:
(2)
Discount rate
(3)
6.75% 5.85% 5.75-6.30%
Rate of compensation increase 3.75% 3.00% 3.00-3.07%
Expected return on plan assets
(4)
8.00% 8.00% 8.00%
(1) Legacy SUPERVALU benefit obligations and the fair value of plan assets were measured as of Novem-
ber 30, 2006. The Acquired Operations benefit obligations and the fair value of plan assets were measured
as of February 22, 2007.
(2) Net periodic benefit expense is measured using weighted average assumptions as of the beginning of each
year.
(3) The Company reviews and selects the discount rate to be used in connection with its pension and other
postretirement obligations annually. In determining the discount rate, the Company uses the yield on cor-
porate bonds (rated AA or better) that coincides with the cash flows of the plans’ estimated benefit pay-
outs. The model uses a yield curve approach to discount each cash flow of the liability stream at an
interest rate specifically applicable to the timing of each respective cash flow. The model totals the present
values of all cash flows and calculates the equivalent weighted average discount rate by imputing the sin-
gular interest rate that equates the total present value with the stream of future cash flows. This resulting
weighted average discount rate is then used in evaluating the final discount rate to be used by the
Company.
(4) Expected long-term return on plan assets is estimated by asset class and is generally based on widely-
accepted capital market principles, long-term return analysis for global fixed income and equity markets,
66