Albertsons 2009 Annual Report Download - page 30
Download and view the complete annual report
Please find page 30 of the 2009 Albertsons annual report below. You can navigate through the pages in the report by either clicking on the pages listed below, or by using the keyword search tool below to find specific information within the annual report.-
 1
1 -
2
-
3
-
4
-
5
-
6
-
7
-
8
-
9
-
10
-
11
-
12
-
13
-
14
-
15
-
16
-
17
-
18
-
19
-
 20
20 -
 21
21 -
 22
22 -
 23
23 -
 24
24 -
 25
25 -
 26
26 -
 27
27 -
 28
28 -
 29
29 -
 30
30 -
 31
31 -
 32
32 -
 33
33 -
 34
34 -
 35
35 -
 36
36 -
 37
37 -
 38
38 -
 39
39 -
 40
40 -
41
-
42
-
43
-
44
-
45
-
46
-
47
-
48
-
49
-
50
-
51
-
52
-
53
-
54
-
55
-
56
-
57
-
58
-
59
-
60
-
61
-
62
-
63
-
64
-
65
-
66
-
67
-
68
-
69
-
70
-
71
-
72
-
73
-
74
-
75
-
76
-
77
-
78
-
79
-
80
-
81
-
82
-
83
-
84
-
85
-
86
-
87
-
88
-
89
-
90
-
91
-
92
-
93
-
94
-
95
-
96
-
97
-
98
-
99
-
100
-
101
-
102
-
103
-
104
 |
 |
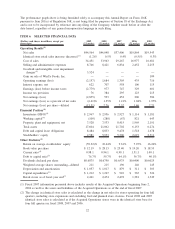
Provision for Income Taxes
Income tax expense was $76, or 2.7 percent of loss before income taxes, for fiscal 2009 compared with $384,
or 39.3 percent of earnings before income taxes, last year. The tax rate for fiscal 2009 reflects the impact of
the goodwill and intangible asset impairment charges, the majority of which are non-deductible for income tax
purposes, as well as a benefit attributable to favorable state tax items, non-taxable life insurance proceeds and
a reduction in the statutory rate.
Net Earnings (Loss)
Net loss was $2,855, or $13.51 per basic and diluted share, for fiscal 2009 compared with net earnings of
$593, or $2.80 per basic share and $2.76 per diluted share last year. Net loss for fiscal 2009 includes charges
of $3,470 after tax, or $16.40 per diluted share, comprised of goodwill and intangible asset impairment
charges, charges primarily related to the closure of non-strategic stores, settlement costs for a pre-Acquisition
Albertsons litigation matter and other Acquisition-related costs. Net earnings for fiscal 2008 include Acquisi-
tion-related costs of $45 after tax, or $0.21 per diluted share.
Comparison of fifty-two weeks ended February 23, 2008 (fiscal 2008) with fifty-two weeks ended
February 24, 2007 (fiscal 2007):
In fiscal 2008, the Company achieved Net sales of $44,048, compared with $37,406 for fiscal 2007. Net
earnings for fiscal 2008 were $593 and diluted net earnings per share were $2.76, compared with net earnings
of $452 and diluted net earnings per share of $2.32 for fiscal 2007. Results for fiscal 2008 include
Acquisition-related costs of $45 after tax, or $0.21 per diluted share, compared to $40 after tax, or $0.20 per
diluted share, of Acquisition-related costs in fiscal 2007. Results for fiscal 2007 also include charges related to
the Company’s disposal of 18 Scott’s banner stores of $23 after tax, or $0.12 per diluted share, which were all
disposed of in fiscal 2008.
Net Sales
Net sales for fiscal 2008 were $44,048, compared with $37,406 for fiscal 2007, an increase of 17.8 percent.
Retail food sales were 78.0 percent of Net sales and Supply chain services sales were 22.0 percent of Net
sales for fiscal 2008, compared with 74.9 percent and 25.1 percent, respectively, for fiscal 2007.
Retail food sales for fiscal 2008 were $34,341, compared with $28,016 for fiscal 2007, an increase of
22.6 percent. The increase was due primarily to the Acquisition. Identical store retail sales growth for fiscal
2008, as compared to fiscal 2007, was 0.1 percent. Identical store retail sales growth on a combined basis, as
if the Acquired Operations stores were in the store base for four full quarters, was 0.5 percent.
During fiscal 2008, the Company added 73 new stores through new store development, acquired eight stores
and closed 85 stores, 28 of which were acquired through the Acquisition.
Total retail square footage as of the end of fiscal 2008 was approximately 71 million, a decrease of 2.5 percent
from the end of fiscal 2007. Total retail square footage, excluding store closures, increased 2.3 percent from
the end of fiscal 2007.
Supply chain services sales for fiscal 2008 were $9,707, compared with $9,390 for fiscal 2007, an increase of
3.4 percent. This increase primarily reflects new business growth, which was partially offset by customer
attrition.
Gross Profit
Gross profit, as a percent of Net sales, was 22.9 percent for fiscal 2008 compared with 21.8 percent for fiscal
2007. The increase in Gross profit, as a percent of Net sales, is primarily due to the impact of the Acquisition
on business segment mix which includes 52 weeks of results of the Acquired Operations in fiscal 2008
compared with 38 weeks in fiscal 2007. The Acquired Operations are part of the Retail food segment which
has a higher Gross profit percentage than Supply chain services.
26