Albertsons 2009 Annual Report Download - page 47
Download and view the complete annual report
Please find page 47 of the 2009 Albertsons annual report below. You can navigate through the pages in the report by either clicking on the pages listed below, or by using the keyword search tool below to find specific information within the annual report.-
 1
1 -
2
-
3
-
4
-
5
-
6
-
7
-
8
-
9
-
10
-
11
-
12
-
13
-
14
-
15
-
16
-
17
-
18
-
19
-
20
-
21
-
22
-
23
-
24
-
25
-
26
-
27
-
28
-
29
-
30
-
31
-
32
-
33
-
34
-
35
-
36
-
 37
37 -
 38
38 -
 39
39 -
 40
40 -
 41
41 -
 42
42 -
 43
43 -
 44
44 -
 45
45 -
 46
46 -
 47
47 -
 48
48 -
 49
49 -
 50
50 -
 51
51 -
 52
52 -
 53
53 -
 54
54 -
 55
55 -
 56
56 -
 57
57 -
58
-
59
-
60
-
61
-
62
-
63
-
64
-
65
-
66
-
67
-
68
-
69
-
70
-
71
-
72
-
73
-
74
-
75
-
76
-
77
-
78
-
79
-
80
-
81
-
82
-
83
-
84
-
85
-
86
-
87
-
88
-
89
-
90
-
91
-
92
-
93
-
94
-
95
-
96
-
97
-
98
-
99
-
100
-
101
-
102
-
103
-
104
 |
 |

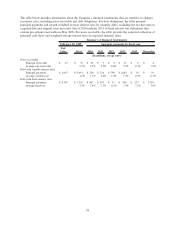
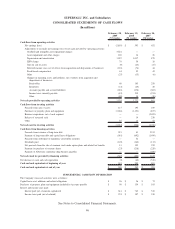
SUPERVALU INC. and Subsidiaries
CONSOLIDATED STATEMENTS OF EARNINGS
(In millions, except per share data)
February 28, 2009
(53 weeks)
February 23, 2008
(52 weeks)
February 24, 2007
(52 weeks)
Net sales $ 44,564 $ 44,048 $ 37,406
Costs and expenses
Cost of sales 34,451 33,943 29,267
Selling and administrative expenses 8,746 8,421 6,834
Goodwill and intangible asset impairment charges 3,524 — —
Operating earnings (loss) (2,157) 1,684 1,305
Interest
Interest expense 633 725 600
Interest income 11 18 42
Interest expense, net 622 707 558
Earnings (loss) before income taxes (2,779) 977 747
Income tax provision 76 384 295
Net earnings (loss) $ (2,855) $ 593 $ 452
Net earnings (loss) per share—basic $ (13.51) $ 2.80 $ 2.38
Net earnings (loss) per share—diluted $ (13.51) $ 2.76 $ 2.32
Weighted average number of shares outstanding
Basic 211 211 189
Diluted 211 215 196
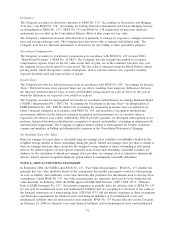
See Notes to Consolidated Financial Statements.
43