Albertsons 2009 Annual Report Download - page 50
Download and view the complete annual report
Please find page 50 of the 2009 Albertsons annual report below. You can navigate through the pages in the report by either clicking on the pages listed below, or by using the keyword search tool below to find specific information within the annual report.-
 1
1 -
2
-
3
-
4
-
5
-
6
-
7
-
8
-
9
-
10
-
11
-
12
-
13
-
14
-
15
-
16
-
17
-
18
-
19
-
20
-
21
-
22
-
23
-
24
-
25
-
26
-
27
-
28
-
29
-
30
-
31
-
32
-
33
-
34
-
35
-
36
-
37
-
38
-
39
-
 40
40 -
 41
41 -
 42
42 -
 43
43 -
 44
44 -
 45
45 -
 46
46 -
 47
47 -
 48
48 -
 49
49 -
 50
50 -
 51
51 -
 52
52 -
 53
53 -
 54
54 -
 55
55 -
 56
56 -
 57
57 -
 58
58 -
 59
59 -
 60
60 -
61
-
62
-
63
-
64
-
65
-
66
-
67
-
68
-
69
-
70
-
71
-
72
-
73
-
74
-
75
-
76
-
77
-
78
-
79
-
80
-
81
-
82
-
83
-
84
-
85
-
86
-
87
-
88
-
89
-
90
-
91
-
92
-
93
-
94
-
95
-
96
-
97
-
98
-
99
-
100
-
101
-
102
-
103
-
104
 |
 |

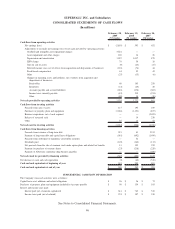
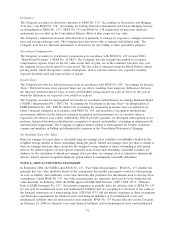
SUPERVALU INC. and Subsidiaries
CONSOLIDATED STATEMENTS OF CASH FLOWS
(In millions)
February 28,
2009
(53 weeks)
February 23,
2008
(52 weeks)
February 24,
2007
(52 weeks)
Cash flows from operating activities
Net earnings (loss) $ (2,855) $ 593 $ 452
Adjustments to reconcile net earnings (loss) to net cash provided by operating activities:
Goodwill and intangible asset impairment charges 3,524 — —
Asset impairment and other charges 169 14 26
Depreciation and amortization 1,057 1,017 879
LIFO charge 78 30 18
Gain on sale of assets (9) (23) (15)
Deferred income taxes, net of effects from acquisition and dispositions of businesses (118) (74) 44
Stock-based compensation 44 52 42
Other (25) (15) (6)
Changes in operating assets and liabilities, net of effects from acquisition and
dispositions of businesses:
Receivables 68 103 258
Inventories (12) (20) 28
Accounts payable and accrued liabilities (216) (278) (683)
Income taxes currently payable (83) 319 (224)
Other (88) 14 (18)
Net cash provided by operating activities 1,534 1,732 801
Cash flows from investing activities
Proceeds from sale of assets 117 195 189
Purchases of property, plant and equipment (1,186) (1,191) (837)
Business acquisitions, net of cash acquired — — (2,402)
Release of restricted cash — 14 238
Other 55 14 52
Net cash used in investing activities (1,014) (968) (2,760)
Cash flows from financing activities
Proceeds from issuance of long-term debt 215 41 3,313
Payment of long-term debt and capital lease obligations (581) (692) (1,490)
Proceeds from settlement of mandatory convertible securities — 52 —
Dividends paid (145) (142) (113)
Net proceeds from the sale of common stock under option plans and related tax benefits 11 153 252
Payment for purchase of treasury shares (23) (218) (220)
Payment of Albertsons standalone drug business payables — — (299)
Net cash (used in) provided by financing activities (523) (806) 1,443
Net decrease in cash and cash equivalents (3) (42) (516)
Cash and cash equivalents at beginning of year 243 285 801
Cash and cash equivalents at end of year $ 240 $ 243 $ 285
SUPPLEMENTAL CASH FLOW INFORMATION
The Company’s non-cash activities were as follows:
Capital lease asset additions and related obligations $ 26 $ 36 $ 73
Purchases of property, plant and equipment included in Accounts payable $ 98 $ 154 $ 105
Interest and income taxes paid:
Interest paid (net of amount capitalized) $ 614 $ 743 $ 545
Income taxes paid (net of refunds) $ 274 $ 107 $ 310
See Notes to Consolidated Financial Statements.
46