Albertsons 2009 Annual Report Download - page 25
Download and view the complete annual report
Please find page 25 of the 2009 Albertsons annual report below. You can navigate through the pages in the report by either clicking on the pages listed below, or by using the keyword search tool below to find specific information within the annual report.-
 1
1 -
2
-
3
-
4
-
5
-
6
-
7
-
8
-
9
-
10
-
11
-
12
-
13
-
14
-
 15
15 -
 16
16 -
 17
17 -
 18
18 -
 19
19 -
 20
20 -
 21
21 -
 22
22 -
 23
23 -
 24
24 -
 25
25 -
 26
26 -
 27
27 -
 28
28 -
 29
29 -
 30
30 -
 31
31 -
 32
32 -
 33
33 -
 34
34 -
 35
35 -
36
-
37
-
38
-
39
-
40
-
41
-
42
-
43
-
44
-
45
-
46
-
47
-
48
-
49
-
50
-
51
-
52
-
53
-
54
-
55
-
56
-
57
-
58
-
59
-
60
-
61
-
62
-
63
-
64
-
65
-
66
-
67
-
68
-
69
-
70
-
71
-
72
-
73
-
74
-
75
-
76
-
77
-
78
-
79
-
80
-
81
-
82
-
83
-
84
-
85
-
86
-
87
-
88
-
89
-
90
-
91
-
92
-
93
-
94
-
95
-
96
-
97
-
98
-
99
-
100
-
101
-
102
-
103
-
104
 |
 |

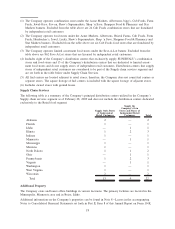
Stock purchases will be made from the cash generated from the settlement of stock options. This annual
authorization program replaced all existing share repurchase programs and continues through June 2009.
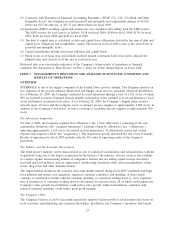
Stock Performance Graph
The following graph compares the yearly change in the Company’s cumulative shareholder return on its
common stock for the period from the end of fiscal 2004 to the end of fiscal 2009 to that of the Standard &
Poor’s (“S&P”) 500 and a group of peer companies in the retail grocery industry. The stock price performance
shown below is not necessarily indicative of future performance.
COMPARISON OF FIVE-YEAR TOTAL RETURN AMONG
SUPERVALU, S&P 500 AND PEER GROUP
(1)
February 27, 2004 through February 27, 2009
(2)
$0
$100
$75
$50
$25
$125
$150
Feb-04 Feb-05 Feb-06 Feb-07 Feb-08 Feb-09
SUPERVALU S&P 500 Peer Group
Date SUPERVALU S&P 500 Peer Group
(3)
February 27, 2004 $100.00 $100.00 $100.00
February 25, 2005 $115.72 $107.65 $ 89.91
February 24, 2006 $117.04 $116.66 $ 84.08
February 23, 2007 $140.49 $133.68 $ 97.89
February 22, 2008 $105.82 $126.90 $101.51
February 27, 2009 $ 61.61 $ 70.62 $ 97.43
(1) Total return assuming $100 invested on February 27, 2004 and reinvestment of dividends on the day they
were paid.
(2) The Company’s fiscal year ends on the last Saturday in February.
(3) The Company’s peer group consists of Delhaize Group SA, Great Atlantic & Pacific Tea Company, Inc.,
Koninklijke Ahold NV, The Kroger Co., Safeway Inc. and Wal-Mart Stores, Inc.
21