Albertsons 2009 Annual Report Download - page 26
Download and view the complete annual report
Please find page 26 of the 2009 Albertsons annual report below. You can navigate through the pages in the report by either clicking on the pages listed below, or by using the keyword search tool below to find specific information within the annual report.-
 1
1 -
2
-
3
-
4
-
5
-
6
-
7
-
8
-
9
-
10
-
11
-
12
-
13
-
14
-
15
-
 16
16 -
 17
17 -
 18
18 -
 19
19 -
 20
20 -
 21
21 -
 22
22 -
 23
23 -
 24
24 -
 25
25 -
 26
26 -
 27
27 -
 28
28 -
 29
29 -
 30
30 -
 31
31 -
 32
32 -
 33
33 -
 34
34 -
 35
35 -
 36
36 -
37
-
38
-
39
-
40
-
41
-
42
-
43
-
44
-
45
-
46
-
47
-
48
-
49
-
50
-
51
-
52
-
53
-
54
-
55
-
56
-
57
-
58
-
59
-
60
-
61
-
62
-
63
-
64
-
65
-
66
-
67
-
68
-
69
-
70
-
71
-
72
-
73
-
74
-
75
-
76
-
77
-
78
-
79
-
80
-
81
-
82
-
83
-
84
-
85
-
86
-
87
-
88
-
89
-
90
-
91
-
92
-
93
-
94
-
95
-
96
-
97
-
98
-
99
-
100
-
101
-
102
-
103
-
104
 |
 |

The performance graph above is being furnished solely to accompany this Annual Report on Form 10-K
pursuant to Item 201(e) of Regulation S-K, is not being filed for purposes of Section 18 of the Exchange Act,
and is not to be incorporated by reference into any filing of the Company, whether made before or after the
date hereof, regardless of any general incorporation language in such filing.
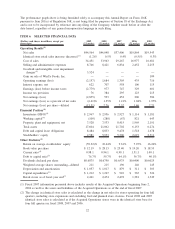
ITEM 6. SELECTED FINANCIAL DATA
(Dollars and shares in millions, except per
share data)
2009
(53 weeks)
2008
(52 weeks)
2007
(52 weeks)
2006
(52 weeks)
2005
(52 weeks)
Operating Results
(1)
Net sales $44,564 $44,048 $37,406 $19,864 $19,543
Identical store retail sales increase (decrease)
(2)
(1.2)% 0.5% 0.4% (0.5)% 0.3%
Cost of sales 34,451 33,943 29,267 16,977 16,681
Selling and administrative expenses 8,746 8,421 6,834 2,452 2,255
Goodwill and intangible asset impairment
charges
(3)
3,524 — — — —
Gain on sale of WinCo Foods, Inc. — — — — 109
Operating earnings (loss) (2,157) 1,684 1,305 435 716
Interest expense, net 622 707 558 106 115
Earnings (loss) before income taxes (2,779) 977 747 329 601
Income tax provision 76 384 295 123 215
Net earnings (loss) (2,855) 593 452 206 386
Net earnings (loss) as a percent of net sales (6.41)% 1.35% 1.21% 1.04% 1.97%
Net earnings (loss) per share—diluted (13.51) 2.76 2.32 1.46 2.71
Financial Position
(1)
Inventories (FIFO)
(4)
$ 2,967 $ 2,956 $ 2,927 $ 1,114 $ 1,181
Working capital
(4)
(109) (280) (67) 821 643
Property, plant and equipment, net 7,528 7,533 8,415 1,969 2,191
Total assets 17,604 21,062 21,702 6,153 6,274
Debt and capital lease obligations 8,484 8,833 9,478 1,518 1,678
Stockholders’ equity 2,581 5,953 5,306 2,619 2,511
Other Statistics
(1)
Return on average stockholders’ equity (59.32)% 10.44% 9.61% 7.95% 16.24%
Book value per share $ 12.19 $ 28.13 $ 25.40 $ 19.20 $ 18.53
Current ratio
(4)
0.98:1 0.94:1 0.99:1 1.51:1 1.40:1
Debt to capital ratio
(5)
76.7% 59.7% 64.1% 36.7% 40.1%
Dividends declared per share $0.6875 $0.6750 $0.6575 $0.6400 $0.6025
Weighted average shares outstanding—diluted 211 215 196 146 145
Depreciation and amortization $ 1,057 $ 1,017 $ 879 $ 311 $ 303
Capital expenditures
(6)
$ 1,212 $ 1,227 $ 910 $ 365 $ 326
Retail stores as of fiscal year end
(7)
2,421 2,474 2,478 1,381 1,549
(1) Fiscal 2007 information presented above includes results of the Acquired Operations beginning June 2,
2006 as well as the assets and liabilities of the Acquired Operations as of the end of fiscal 2007.
(2) The change in identical store sales is calculated as the change in net sales for stores operating for four full
quarters, including store expansions and excluding fuel and planned store closures. Fiscal 2008 and 2007
identical store sales is calculated as if the Acquired Operations stores were in the identical store base for
four full quarters in fiscal 2008, 2007 and 2006.
22