Albertsons 2009 Annual Report Download - page 49
Download and view the complete annual report
Please find page 49 of the 2009 Albertsons annual report below. You can navigate through the pages in the report by either clicking on the pages listed below, or by using the keyword search tool below to find specific information within the annual report.-
 1
1 -
2
-
3
-
4
-
5
-
6
-
7
-
8
-
9
-
10
-
11
-
12
-
13
-
14
-
15
-
16
-
17
-
18
-
19
-
20
-
21
-
22
-
23
-
24
-
25
-
26
-
27
-
28
-
29
-
30
-
31
-
32
-
33
-
34
-
35
-
36
-
37
-
38
-
 39
39 -
 40
40 -
 41
41 -
 42
42 -
 43
43 -
 44
44 -
 45
45 -
 46
46 -
 47
47 -
 48
48 -
 49
49 -
 50
50 -
 51
51 -
 52
52 -
 53
53 -
 54
54 -
 55
55 -
 56
56 -
 57
57 -
 58
58 -
 59
59 -
60
-
61
-
62
-
63
-
64
-
65
-
66
-
67
-
68
-
69
-
70
-
71
-
72
-
73
-
74
-
75
-
76
-
77
-
78
-
79
-
80
-
81
-
82
-
83
-
84
-
85
-
86
-
87
-
88
-
89
-
90
-
91
-
92
-
93
-
94
-
95
-
96
-
97
-
98
-
99
-
100
-
101
-
102
-
103
-
104
 |
 |

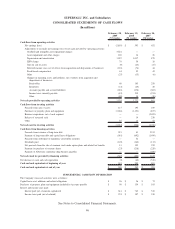
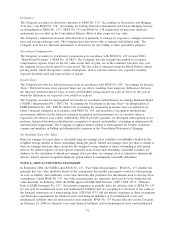
SUPERVALU INC. and Subsidiaries
CONSOLIDATED STATEMENTS OF STOCKHOLDERS’ EQUITY
(In millions, except per share data)
Common
Stock
Capital in
Excess
of Par
Value
Treasury
Stock
Accumulated
Other
Comprehensive
Losses
Retained
Earnings
Total
Stockholders’
Equity
Comprehensive
Income (Loss)
Balances as of February 25, 2006 $ 151 $ 132 $ (313) $ (128) $ 2,777 $ 2,619
Net earnings — — — — 452 452 $ 452
Pension and other postretirement activity (net
of tax of $71 and $17, respectively) — — — (107) — (107) (26)
Stock, options and restricted stock units
issued in connection with acquisition of
New Albertsons 69 2,327 — — — 2,396 —
Sales of common stock under option plans 8 221 30 — — 259 —
Cash dividends declared on common stock
$0.6575 per share — — — — (126) (126) —
Compensation under employee incentive
plans 1 28 4 — — 33 —
Purchase of shares for treasury — — (220) — — (220) —
Balances as of February 24, 2007 229 2,708 (499) (235) 3,103 5,306 $ 426
Effects of changing pension plan
measurement date pursuant to
SFAS No. 158 (net of tax of $20 and $7,
respectively) — — — 32 (10) 22
Beginning balance, as adjusted 229 2,708 (499) (203) 3,093 5,328
Net earnings — — — — 593 593 $ 593
Pension and other postretirement activity (net
of tax of $70) — — — 108 — 108 108
Sales of common stock under option plans — 3 141 — — 144 —
Cash dividends declared on common stock
$0.6750 per share — — — — (143) (143) —
Compensation under employee incentive
plans — 49 (4) — — 45 —
Shares issued in settlement of zero-coupon
convertible debentures and mandatory
convertible securities 1 62 33 — — 96 —
Purchase of shares for treasury — — (218) — — (218) —
Balances as of February 23, 2008 230 2,822 (547) (95) 3,543 5,953 $ 701
Net loss — — — — (2,855) (2,855) $ (2,855)
Pension and other postretirement activity (net
of tax of $261) (408) — (408) (408)
Sales of common stock under option plans — 2 12 — — 14 —
Cash dividends declared on common stock
$0.6875 per share — — — — (146) (146) —
Compensation under employee incentive
plans — 29 17 — — 46 —
Purchase of share for treasury — — (23) — — (23) —
Balances as of February 28, 2009 $ 230 $ 2,853 $ (541) $ (503) $ 542 $ 2,581 $ (3,263)
See Notes to Consolidated Financial Statements.
45