Albertsons 2009 Annual Report Download - page 27
Download and view the complete annual report
Please find page 27 of the 2009 Albertsons annual report below. You can navigate through the pages in the report by either clicking on the pages listed below, or by using the keyword search tool below to find specific information within the annual report.-
 1
1 -
2
-
3
-
4
-
5
-
6
-
7
-
8
-
9
-
10
-
11
-
12
-
13
-
14
-
15
-
16
-
 17
17 -
 18
18 -
 19
19 -
 20
20 -
 21
21 -
 22
22 -
 23
23 -
 24
24 -
 25
25 -
 26
26 -
 27
27 -
 28
28 -
 29
29 -
 30
30 -
 31
31 -
 32
32 -
 33
33 -
 34
34 -
 35
35 -
 36
36 -
 37
37 -
38
-
39
-
40
-
41
-
42
-
43
-
44
-
45
-
46
-
47
-
48
-
49
-
50
-
51
-
52
-
53
-
54
-
55
-
56
-
57
-
58
-
59
-
60
-
61
-
62
-
63
-
64
-
65
-
66
-
67
-
68
-
69
-
70
-
71
-
72
-
73
-
74
-
75
-
76
-
77
-
78
-
79
-
80
-
81
-
82
-
83
-
84
-
85
-
86
-
87
-
88
-
89
-
90
-
91
-
92
-
93
-
94
-
95
-
96
-
97
-
98
-
99
-
100
-
101
-
102
-
103
-
104
 |
 |
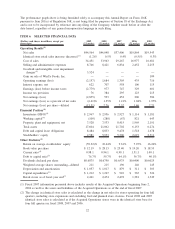
(3) Consistent with Statement of Financial Accounting Standards (“SFAS”) No. 142, “Goodwill and Other
Intangible Assets” the Company recorded goodwill and intangible asset impairment charges of $3,524
before tax ($3,326 after tax, or $15.71 per diluted share) in fiscal 2009.
(4) Inventories (FIFO), working capital and current ratio are calculated after adding back the LIFO reserve.
The LIFO reserve for each year is as follows: $258 for fiscal 2009, $180 for fiscal 2008, $178 for fiscal
2007, $160 for fiscal 2006 and $149 for fiscal 2005.
(5) The debt to capital ratio is calculated as debt and capital lease obligations divided by the sum of debt and
capital lease obligations and stockholders’ equity. The increase in fiscal 2009 is due to the write-down of
goodwill and intangible assets.
(6) Capital expenditures include fixed asset additions and capital leases.
(7) Retail stores as of fiscal year end includes licensed limited assortment food stores and is adjusted for
planned sales and closures as of the end of each fiscal year.
Historical data is not necessarily indicative of the Company’s future results of operations or financial
condition. See discussion of “Risk Factors” in Part I, Item 1A of this Annual Report on Form 10-K.
ITEM 7. MANAGEMENT’S DISCUSSION AND ANALYSIS OF FINANCIAL CONDITION AND
RESULTS OF OPERATIONS
OVERVIEW
SUPERVALU is one of the largest companies in the United States grocery channel. The Company operates in
two segments of the grocery industry, Retail food and Supply chain services, primarily wholesale distribution.
As of February 28, 2009, the Company conducted its retail operations through a total of 2,421 stores of which
862 are licensed locations. Principal formats include combination stores (defined as food and pharmacy), food
stores and limited assortment food stores. As of February 28, 2009, the Company’s Supply chain services
network spans 49 states and the Company serves as primary grocery supplier to approximately 2,000 stores, in
addition to the Company’s own stores, as well as serving as secondary grocery supplier to approximately 700
stores.
The Albertsons Acquisition
On June 2, 2006, the Company acquired New Albertson’s, Inc. (“New Albertsons”) consisting of the core
supermarket businesses (the “Acquired Operations”) formerly owned by Albertson’s, Inc. (“Albertsons”)
operating approximately 1,125 stores, the related in-store pharmacies, 10 distribution centers and certain
regional and corporate offices (the “Acquisition”). The Acquisition greatly increased the size of the Company.
Results of operations for fiscal 2007 includes only the 38 weeks of operating results of the Acquired
Operations.
The Industry and the Economic Environment
The retail grocery industry can be characterized as one of continued consolidation and rationalization, with the
Acquisition being one of the largest acquisitions in the history of the industry. Grocery retailers also continue
to compete against an increasing number of competitive formats that are adding square footage devoted to
food and non-food products, such as supercenters, membership warehouse clubs, mass merchandisers, dollar
stores, drug stores and other alternate formats.
The unprecedented decline in the economy and credit market turmoil during fiscal 2009 combined with high
food inflation and energy costs negatively impacted consumer confidence and spending. If these trends
continue, it could lead to further reduced consumer spending, to consumers trading down to a less expensive
mix of products or to consumers trading down to discounters for grocery items, all of which could impact the
Company’s sales growth. Food deflation could reduce sales growth, while food inflation, combined with
reduced consumer spending, could reduce gross profit margins.
The Company’s Plan
The Company believes it can be successful against this industry backdrop with its retail formats that focus on
local execution, merchandising and consumer knowledge. In addition, the Company’s operations will benefit
23